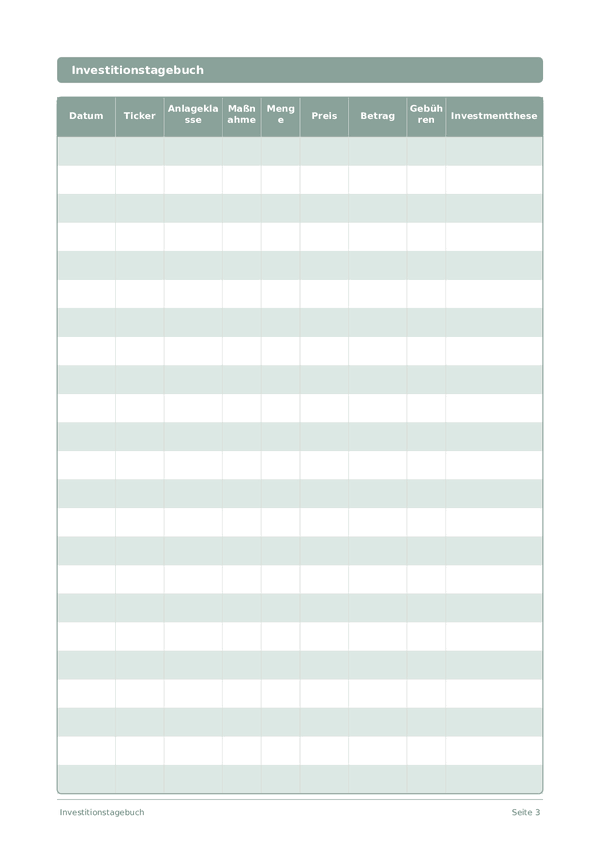
Printable Investitionstagebuch
Trades verfolgen, Entscheidungen analysieren und Ihr Portfolio aufbauen
A structured investment journal for recording every trade — ticker, asset class, price, quantity, and your reasoning behind each decision. Reviewing past entries reveals patterns in your strategy, helps you avoid repeating mistakes, and builds the discipline that separates consistent investors from impulsive ones.
Felder anpassen
Schalten Sie Felder ein oder aus. Klicken Sie auf den Stift zum Umbenennen oder fügen Sie eigene Felder hinzu.
Vorteile
Anleitung
Was ist dieses Journal?
An investment journal is a disciplined record-keeping tool for anyone who actively manages their investment portfolio. By logging every transaction — the ticker, asset class, action taken, quantity, price, total amount, fees, and your investment thesis — you create an invaluable archive of your decision-making process. This journal serves both as a practical ledger and as a learning tool that helps you become a better investor over time.
The most common mistake investors make is acting on emotion rather than analysis. A journal combats this by requiring you to articulate your investment thesis before or immediately after each trade. When you must write down why you are buying or selling, you naturally become more thoughtful and deliberate. Reviewing past entries reveals whether your reasoning was sound, which strategies generated returns, and where emotional decisions led to losses.
Whether you invest in individual stocks, ETFs, bonds, cryptocurrency, or real estate, this journal adapts to any asset class. It is especially valuable during volatile markets, where the temptation to panic-sell or chase gains is strongest. Having a written record of your original thesis provides the anchor of rationality that keeps you on your long-term plan.
Ausgefülltes Beispiel
So sieht ein typischer Eintrag aus, wenn er ausgefüllt ist:
| Datum | Ticker | Anlageklasse | Maßnahme | Menge | Preis | Betrag | Gebühren | Investmentthese |
|---|---|---|---|---|---|---|---|---|
| 2026-03-01 | VTI | ETF (US Total Market) | Buy | 15 | 268.5 | 4027.5 | 0 | Monthly DCA into broad market index. Long-term core holding. |
| 2026-03-01 | AAPL | Stock (Tech) | Buy | 10 | 192.3 | 1923 | 0 | Strong Services revenue growth, AI integration, attractive P/E after pullback. |
| 2026-03-02 | BND | ETF (Bonds) | Buy | 20 | 72.8 | 1456 | 0 | Rebalancing to 20% bonds allocation. Rate cuts expected in H2 2026. |
| 2026-03-03 | TSLA | Stock (Tech) | Sell | 5 | 245 | 1225 | 0 | Taking partial profits after 35% run-up. Valuation looks stretched. |
| 2026-03-03 | BTC | Crypto | Buy | 0.05 | 82000 | 4100 | 12.3 | Small allocation (2% of portfolio). Halving cycle thesis, long-term hold. |
Wie Sie jedes Feld ausfüllen
Jede Seite ist eine Tabelle mit Spalten. Füllen Sie pro Eintrag eine Zeile aus. Hier erfahren Sie, wofür jede Spalte gedacht ist:
Datum
Schreiben Sie das heutige Datum. Dies verankert Ihren Eintrag in der Zeit und hilft beim späteren Durchsehen der Einträge.
Ticker
Anlageklasse
Maßnahme
Menge
Preis
Wie viel hast du bezahlt? Flaschenpreis in deiner Landeswährung
Betrag
Erfassen Sie den Betrag für diesen Eintrag. Seien Sie präzise — Rundungen erzeugen Ungenauigkeiten, die sich über die Zeit summieren.
Gebühren
Investmentthese
Tipps für den Erfolg
Wann und wie oft schreiben
Make an entry every time you execute a trade — capture the reasoning, position size, and conviction level in the moment, not after the outcome. For open positions, do a weekly check-in: has the thesis changed? Are you still within your risk parameters? Monthly, review all closed positions and calculate your win rate, average gain vs. average loss, and return by asset class. Quarterly, read back through your thesis entries and grade yourself on discipline.
Häufig gestellte Fragen
Warum sollte ich bei jedem Trade eine Anlagethese festhalten?
Das schriftliche Festhalten Ihrer Begründung beim Kauf reduziert den Rückschaufehler und unterstützt die spätere Auswertung. Die SEC (2023, investor.gov, 'Investing Quick Tips') (deutsche Aufsicht: BaFin) fordert Anleger auf, Entscheidungen zu dokumentieren und emotionalen Handel zu vermeiden. Kahneman, 'Thinking, Fast and Slow' (Farrar, Straus & Giroux, 2011) zeigt, dass schriftlich festgehaltene Entscheidungen späterer Selbstrechtfertigung widerstehen. Die Spalte investmentthese macht diese Gewohnheit in jeder Zeile operativ. Dies ist keine Anlageberatung.
Wie nutze ich die Spalte anlageklasse zur Überwachung der Diversifikation?
Markieren Sie jeden Trade nach Anlageklasse - Aktien, ETFs, Anleihen, Krypto - und summieren Sie dann amount monatlich nach Klasse, um die Drift der Allokation zu erkennen. Die SEC (2023, investor.gov, 'Beginners' Guide to Asset Allocation') (deutsche Aufsicht: BaFin) bezeichnet Diversifikation als zentrale Disziplin des Risikomanagements. Die Kombination der Spalten anlageklasse und amount verwandelt ein Transaktionsbuch ohne externe Software in einen vollwertigen Allokationsbericht.
Wie unterscheidet sich dieses Papierjournal von einem Brokerauszug?
Brokerauszüge zeigen, was Sie getan haben; dieses Journal hält fest, warum. Die neun Spalten - darunter investmentthese, fees und anlageklasse - bewahren die Absicht neben der Ausführung. Die SEC (2023, investor.gov, 'Investor Bulletin: Keep Records') empfiehlt persönliche Aufzeichnungen unabhängig von Brokerberichten zur steuerlichen Untermauerung und Entscheidungsprüfung, besonders bei mehreren Konten oder Plattformen. Dies ist keine Anlageberatung.
Warum muss ich bei jedem Eintrag die Gebühren erfassen?
Gebühren akkumulieren und schmälern die Rendite stärker, als die meisten Anleger schätzen. Die SEC (2014, 'Investor Bulletin: How Fees and Expenses Affect Your Investment Portfolio') zeigt, dass eine jährliche Gebühr von 1 Prozent den Portfoliowert über Jahrzehnte um Zehntausende reduzieren kann. Die Spalte fees erzwingt bei jedem Trade Bewusstsein statt nur einmal im Jahr beim Kontoauszug. So wird der wahre Kostenfaktor unmittelbar sichtbar.
Verbessert ein Anlagejournal die Ergebnisse tatsächlich?
Dokumentation unterstützt den Kreislauf bewusster Praxis - aufzeichnen, prüfen, anpassen. Das CFPB (2022, 'Tools for Tracking Your Money') (in Deutschland: BaFin, Verbraucherzentrale) befürwortet schriftliche Aufzeichnungen für jede Finanzaktivität. Kein Journal garantiert Renditen, doch das Schreiben der investmentthese und die monatliche Prüfung wirken der dokumentierten Selbstüberschätzung und Verlustaversion entgegen, die Kahneman, 'Thinking, Fast and Slow' (Farrar, Straus & Giroux, 2011) beschreibt.
Eignet sich dieses Journal für ETF- und Indexfondsanleger?
Ja. Die Spalte anlageklasse fasst ETFs, Indexfonds, Anleihen oder Einzelaktien gleichermassen. Selbst Buy-and-Hold-Anleger profitieren vom Festhalten der Einzahlungen und Begründungen - die SEC (2023, investor.gov, 'Mutual Funds and ETFs') empfiehlt eine regelmässige Überprüfung der Allokation. Für seltene Trader umfasst die 12-Zeilen-Seite etwa ein Jahr monatlicher Einzahlungen und macht die Prüfung zur Steuerzeit einfach. Dies ist keine Anlageberatung.
Welche häufigen Fehler hilft mir dieses Journal zu vermeiden?
Zwei grosse - dem Performance hinterherzulaufen und zu vergessen, warum Sie gekauft haben. Die SEC (2023, investor.gov, 'Investor Alerts') warnt, dass Strategiewechsel auf Basis jüngster Renditen die Langfristperformance zerstören. Das Ausfüllen von investmentthese erzwingt einen Satz Begründung; die monatliche Prüfung deckt Musterfehler wie Überkonzentration, Panikverkäufe oder das wiederholte Kaufen von Narrativen statt Fundamentaldaten auf.
Wie oft sollte ich meine Journaleinträge überprüfen?
Eine monatliche Prüfung ist für die meisten Anleger der richtige Rhythmus - oft genug, um Drift zu erkennen, selten genug, um Übertrading zu vermeiden. Die SEC (2023, investor.gov, 'Rebalancing Your Portfolio') empfiehlt, die Allokation in festen Intervallen zu prüfen, statt auf Marktbewegungen zu reagieren. Mit 12 Zeilen pro Seite entspricht eine Seite ungefähr einem Prüfzyklus; scannen Sie investmentthese-Einträge und anlageklasse-Summen gemeinsam.
Das könnte Ihnen auch gefallen
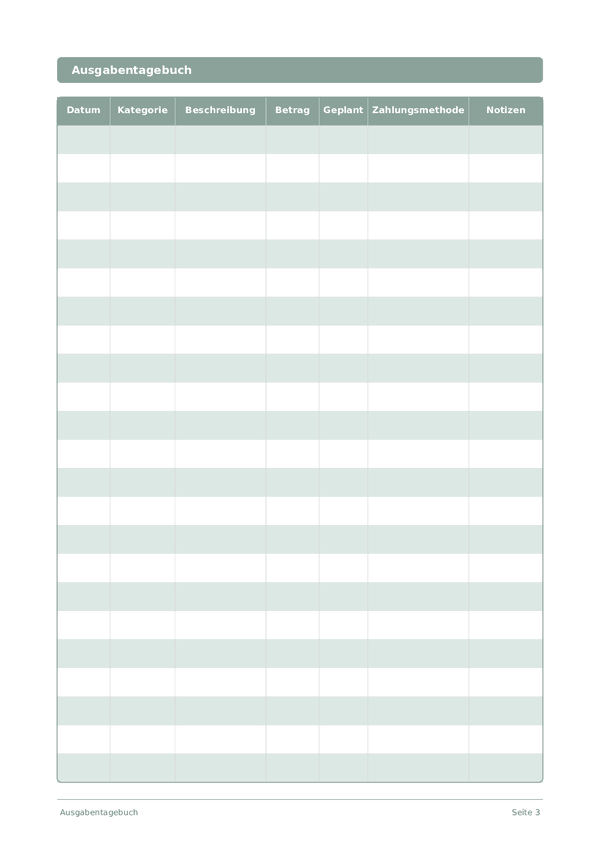
Ausgabentagebuch
Jeden Euro verfolgen und die Kontrolle über Ihre Finanzen übernehmen
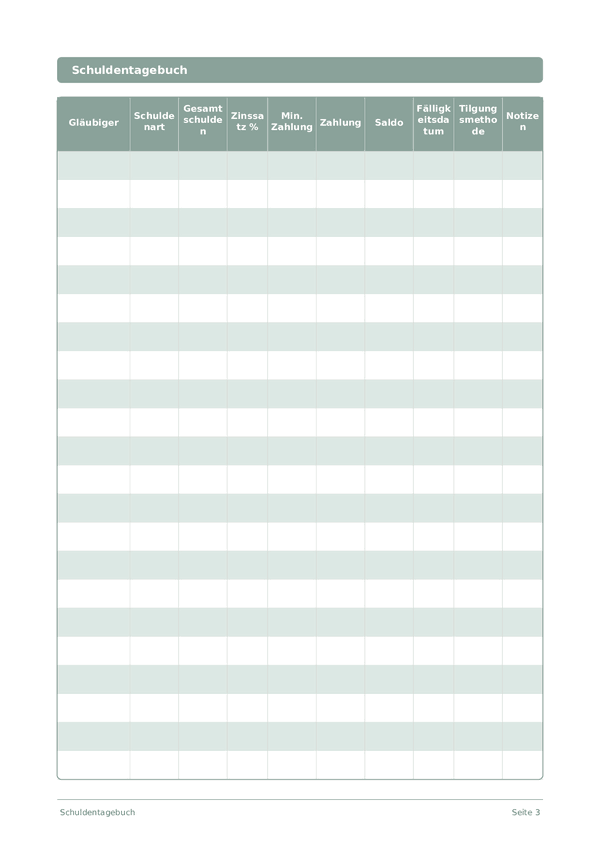
Schuldentagebuch
Schulden verfolgen und mit einer klaren Tilgungsstrategie abbauen
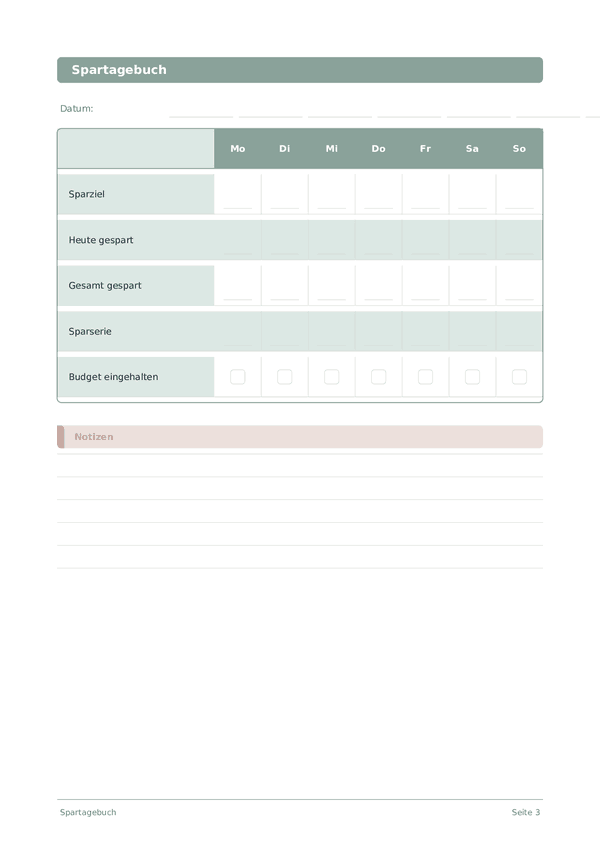
Spartagebuch
Tägliche Spargewohnheiten verfolgen und auf Ihre finanziellen Ziele hinarbeiten
Karrieretagebuch
Erfolge verfolgen und berufliches Wachstum täglich beschleunigen
Scrollen zum Zoomen, ziehen zum Bewegen