Printable Periodentagebuch
Menstruationszyklus-Tracker und Symptomprotokoll
Track your menstrual cycle with detailed symptom logging, mood and energy patterns, and phase awareness. Build a comprehensive picture of your cycle for better health and self-understanding.
Felder anpassen
Schalten Sie Felder ein oder aus. Klicken Sie auf den Stift zum Umbenennen oder fügen Sie eigene Felder hinzu.
Was ist dieses Journal?
A period journal is a daily tracker where you record the details of your menstrual cycle — cycle day, flow intensity, pain levels, mood, energy, and common symptoms like bloating, cravings, and headaches. By tracking these patterns consistently cycle after cycle, you develop a deep understanding of your body's rhythms that no app algorithm can replicate, because it is grounded in your own lived experience.
This journal is for anyone who menstruates and wants to understand their cycle better. Whether you are trying to predict your period more accurately, manage painful symptoms, prepare for hormonal shifts that affect your mood and energy, or gather data to share with a gynecologist, this tracker gives you a structured and private space to record it all.
Many people are surprised by what their period journal reveals. You might discover that your energy peaks during the follicular phase, that headaches reliably appear two days before your period, or that cravings are strongest on specific cycle days. This knowledge is empowering — it allows you to plan demanding tasks for your high-energy days, prepare for symptom management before symptoms start, and have informed conversations with healthcare providers about your menstrual health.
Ausgefülltes Beispiel
So sieht ein typischer Eintrag aus, wenn er ausgefüllt ist:
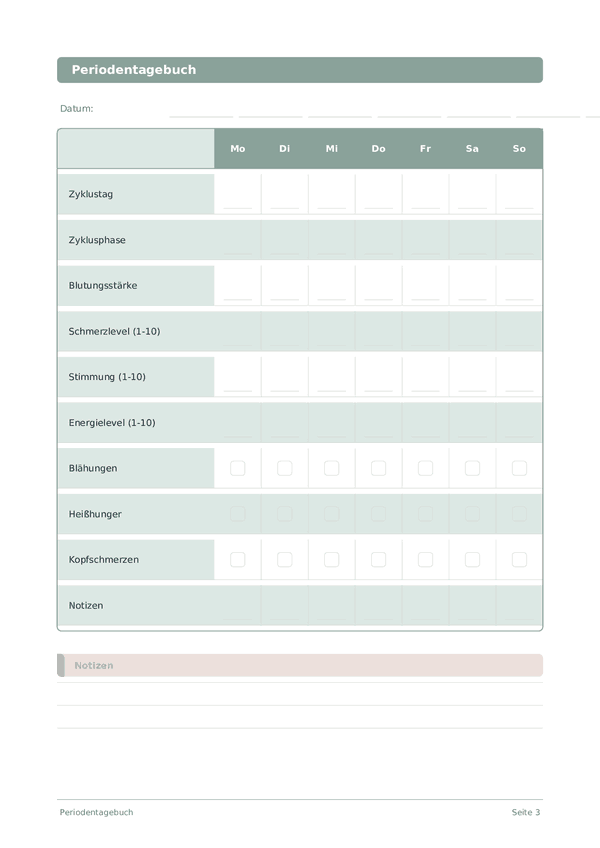
| Mon | Tue | Wed | Thu | Fri | Sat | Sun | |
|---|---|---|---|---|---|---|---|
| Zyklustag | 1 | 2 | 3 | 4 | 5 | 6 | 7 |
| Zyklusphase | Menstrual | Menstrual | Menstrual | Menstrual | Menstrual | Follicular | Follicular |
| Blutungsstärke | 3 | 8 | 7 | 5 | 3 | 1 | 0 |
| Schmerzlevel (1-10) | 7 | 6 | 4 | 3 | 2 | 1 | 0 |
| Stimmung (1-10) | 4 | 5 | 5 | 6 | 6 | 7 | 8 |
| Energielevel (1-10) | 3 | 4 | 4 | 5 | 6 | 7 | 8 |
| Blähungen | ✓ | ✓ | ✓ | ✓ | |||
| Heißhunger | ✓ | ✓ | ✓ | ||||
| Kopfschmerzen | ✓ | ||||||
| Notizen | First day, heavy cramps in the morning. Took ibuprofen. | Heaviest day. Stayed home. Hot water bottle helped. | Flow easing. Mild cramps in the evening. | Much lighter. Energy starting to return. | Spotting only. Felt almost normal. | Period basically over. Good energy. | Feeling great. Went for a run. |
Wie Sie jedes Feld ausfüllen
Jede Seite ist ein Wochenraster. Die Zeilen sind Ihre Tracking-Elemente, die Spalten sind die Wochentage. Hier erfahren Sie, was jedes Element bedeutet:
Zyklustag
Notieren Sie, an welchem Tag Ihres Zyklus Sie sich befinden. Konsequentes Verfolgen hilft, zukünftige Zyklen vorherzusagen und Unregelmäßigkeiten zu erkennen.
Zyklusphase
Blutungsstärke
Schmerzlevel (1-10)
Bewerten Sie Ihre Schmerzintensität auf einer Skala. Das Verfolgen der Schmerzwerte hilft, Auslöser zu identifizieren, Behandlungen zu bewerten und mit Gesundheitsdienstleistern zu kommunizieren.
Stimmung (1-10)
Bewerten Sie Ihren allgemeinen emotionalen Zustand für den Tag. 1 bedeutet sehr niedergeschlagen oder deprimiert, 10 bedeutet außergewöhnlich glücklich und positiv. Denken Sie nicht zu lange nach — vertrauen Sie Ihrem Bauchgefühl.
Energielevel (1-10)
Bewerten Sie Ihr körperliches und geistiges Energieniveau. 1 bedeutet erschöpft und ausgelaugt, 10 bedeutet voller Energie und wach. Dies hilft Ihnen zu erkennen, welche Aktivitäten Ihre Energie steigern oder verbrauchen.
Blähungen
Heißhunger
Kopfschmerzen
Notizen
Fügen Sie zusätzlichen Kontext oder Gedanken hinzu. Diese Auffangspalte ist für alles, was nirgendwo anders hinpasst, aber später nützlich sein könnte.
Tipps für den Erfolg
Wann und wie oft schreiben
Mark flow and symptoms every day during your period, and note any mid-cycle symptoms (ovulation pain, spotting, discharge changes) as they occur. On non-event days, a quick daily check-in about mood and energy still provides valuable cycle data. At the end of each cycle, review the full pattern. After 3 months, you will be able to predict symptom onset and prepare accordingly. Share tracked data with your gynecologist at annual checkups for more productive appointments.
Häufig gestellte Fragen
Warum die Zyklusphase neben dem Zyklustag erfassen?
ACOG (2015, bestätigt 2022) empfiehlt beides aufzuzeichnen, weil die Phase den hormonellen Kontext zeigt, während der Tag Vorhersagen ermöglicht. Die vier Phasen — Menstruation, Follikel-, Ovulations-, Lutealphase — bewirken laut NIH NICHD-Referenzdaten vorhersagbare Verschiebungen bei Stimmung, Energie, Schmerz und Blähungen. Das Wissen um die Lutealphase erklärt prämenstruelle Symptome; beide Felder zu protokollieren ermöglicht Ihrer Gynäkologin die Korrelation von Beschwerden mit dem relevanten Hormonfenster (in Deutschland: Leitlinien der DGGG).
Was gilt als 'normale' Zykluslänge und Blutung?
ACOG definiert normal als Zyklen von 21–35 Tagen mit 2–7 Tagen Blutung. Starke Menstruationsblutung (Menorrhagie) ist im Allgemeinen >80 ml gesamt oder ein Tampon/eine Binde stündlich durchgeblutet. Die blutungsstärke-Skala 0–10 erfasst subjektive Veränderungen über Zeit nützlicher als das absolute Volumen. Anhaltende Zyklen außerhalb dieses Bereichs oder plötzliche Änderungen rechtfertigen eine gynäkologische Abklärung.
Wie hilft das Tagebuch bei Diagnosen wie PCOS oder Endometriose?
Gynäkologinnen nutzen 3–6 Monate Zyklusdaten, um Muster zu identifizieren, die auf PCOS (unregelmäßige Zyklen, oft >35 Tage), Endometriose (starker Schmerz ≥7/10, besonders bei Menstruation), PMDS (Stimmungswerte 7+ Tage vor Menstruation) oder Myome (starke Blutung) hindeuten. ACOG und NICE stützen sich auf Patientinnentagebücher zur Differentialdiagnose. Die schmerzlevel (1-10)- und blutungsstärke-Bewertungen in Kombination mit Stimmungswerten liefern Ihrer Ärztin Belege jenseits eines einzigen Termins.
Was zeigen die Checkboxen für Blähungen, Heißhunger und Kopfschmerzen?
Dies sind Kernsymptome des prämenstruellen Syndroms (PMS) laut NIH NICHD-Kriterien. Die APA definiert PMDS, wenn 5+ Symptome in der Lutealphase der meisten Zyklen auftreten. Das Abhaken über 2–3 Zyklen zeigt, ob Symptome konsistent zyklisch (PMS/PMDS) oder zufällig sind. Diese Unterscheidung ist wichtig für die Behandlung — SSRI helfen bei PMDS; Lifestyle-Interventionen bei leichtem PMS, laut ACOG-Leitlinien.
Wie unterscheidet sich das von Apps wie Clue oder Flo?
Apps speichern und prognostizieren; Papiertagebücher fördern Reflexion. Viele Tracking-Apps teilen Daten mit Dritten — ein von HHS und FTC markiertes Datenschutzthema. In Deutschland sind Menstruationsdaten besonders sensibel (DSGVO). Das Papierformat hält Menstruationsdaten vollständig privat. Die 0–10-Bewertungen ermöglichen zudem nuancierteres Tracking als die meisten Binär-Checkboxen in Apps. Nutzen Sie beides — Papier für sensible Notizen, App für Vorhersagen.
Kann ich perimenopausale Zyklen mit diesem Tagebuch erfassen?
Ja. NIA und ACOG beschreiben die Perimenopause (typischerweise 45–55 Jahre) durch unregelmäßige Zykluslängen, Hitzewallungen und Stimmungsschwankungen. Die blutungsstärke-, mood- und energy-Bewertungen erfassen diesen Übergang gut; zyklustag bleibt nützlich auch bei längeren Zyklen. Bringen Sie 6+ Monate Daten zu Ihrer Gynäkologin, wenn Zyklen konsistent >35 Tage werden oder Monate ausbleiben — dies hilft bei der Menopause-Staging und schließt andere Ursachen aus.
Wie lange bis Tracking-Muster nützlich werden?
ACOG empfiehlt 3 vollständige Zyklen zur Basis-Charakterisierung und 6 Zyklen zur Erkennung zyklischer Störungen wie PMDS. Der erste Monat zeigt oft wenig, da die Phasen-Identifizierung das Wissen um den nächsten Menstruationsbeginn voraussetzt. Nach 3 Zyklen werden durchschnittliche Zykluslänge, Ovulationsmuster (durch Energie- und Stimmungsverschiebungen mittzyklisch) und Symptomcluster klar. Eine verlässliche PMS/PMDS-Diagnose erfordert mindestens 2 prospektiv protokollierte Zyklen.
Wann sollten Zyklusveränderungen einen Arztbesuch auslösen?
Red Flags von ACOG und Mayo Clinic: Zyklen konsistent kürzer als 21 oder länger als 35 Tage, Blutung länger als 7 Tage, sehr starke Blutung (Binde stündlich durchgeblutet), schwere Schmerzen ohne Ansprechen auf OTC-Analgetika, Zwischenblutungen oder plötzliche Zyklusveränderungen. Bringen Sie mindestens 3 Zyklen Tagebuchdaten mit. Plötzliches Ausbleiben der Menstruation rechtfertigt einen Schwangerschaftstest und eine Abklärung, falls Schwangerschaft ausgeschlossen ist.
Das könnte Ihnen auch gefallen
Scrollen zum Zoomen, ziehen zum Bewegen