Printable Investment Journal
Track trades, analyze decisions, and grow your portfolio
A structured investment journal for recording every trade — ticker, asset class, price, quantity, and your reasoning behind each decision. Reviewing past entries reveals patterns in your strategy, helps you avoid repeating mistakes, and builds the discipline that separates consistent investors from impulsive ones.
Personalizar campos
Activa o desactiva campos. Haz clic en el lápiz para renombrar, o añade tus propios campos.
Beneficios
Cómo Usar
¿Qué es este diario?
An investment journal is a disciplined record-keeping tool for anyone who actively manages their investment portfolio. By logging every transaction — the ticker, asset class, action taken, quantity, price, total amount, fees, and your investment thesis — you create an invaluable archive of your decision-making process. This journal serves both as a practical ledger and as a learning tool that helps you become a better investor over time.
The most common mistake investors make is acting on emotion rather than analysis. A journal combats this by requiring you to articulate your investment thesis before or immediately after each trade. When you must write down why you are buying or selling, you naturally become more thoughtful and deliberate. Reviewing past entries reveals whether your reasoning was sound, which strategies generated returns, and where emotional decisions led to losses.
Whether you invest in individual stocks, ETFs, bonds, cryptocurrency, or real estate, this journal adapts to any asset class. It is especially valuable during volatile markets, where the temptation to panic-sell or chase gains is strongest. Having a written record of your original thesis provides the anchor of rationality that keeps you on your long-term plan.
Ejemplo completado
Así es como se ve una entrada típica cuando se rellena:
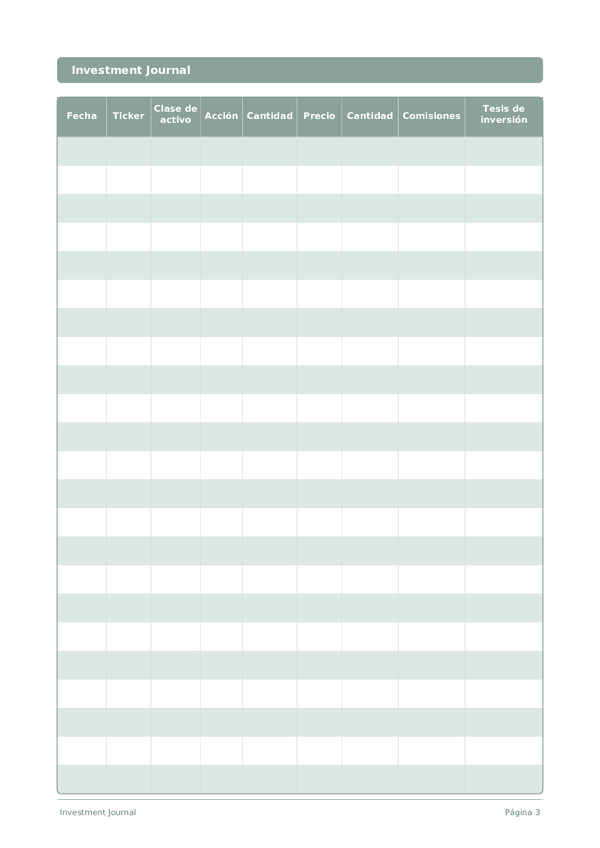
| Fecha | Ticker | Clase de activo | Acción | Cantidad | Precio | Cantidad | Comisiones | Tesis de inversión |
|---|---|---|---|---|---|---|---|---|
| 2026-03-01 | VTI | ETF (US Total Market) | Buy | 15 | 268.5 | 4027.5 | 0 | Monthly DCA into broad market index. Long-term core holding. |
| 2026-03-01 | AAPL | Stock (Tech) | Buy | 10 | 192.3 | 1923 | 0 | Strong Services revenue growth, AI integration, attractive P/E after pullback. |
| 2026-03-02 | BND | ETF (Bonds) | Buy | 20 | 72.8 | 1456 | 0 | Rebalancing to 20% bonds allocation. Rate cuts expected in H2 2026. |
| 2026-03-03 | TSLA | Stock (Tech) | Sell | 5 | 245 | 1225 | 0 | Taking partial profits after 35% run-up. Valuation looks stretched. |
| 2026-03-03 | BTC | Crypto | Buy | 0.05 | 82000 | 4100 | 12.3 | Small allocation (2% of portfolio). Halving cycle thesis, long-term hold. |
Cómo rellenar cada campo
Cada pagina es una tabla con columnas. Completa una fila por entrada. Esto es lo que significa cada columna:
Fecha
Escribe la fecha de hoy. Esto ancla tu entrada en el tiempo y ayuda cuando revisas entradas despues.
Ticker
Clase de activo
Acción
Cantidad
Precio
Cuanto pagaste? Precio de la botella en tu moneda local
Cantidad
Registra el monto de esta entrada. Se preciso: el redondeo crea inexactitudes que se acumulan con el tiempo.
Comisiones
Tesis de inversión
Consejos para el exito
Cuando y con que frecuencia escribir
Make an entry every time you execute a trade — capture the reasoning, position size, and conviction level in the moment, not after the outcome. For open positions, do a weekly check-in: has the thesis changed? Are you still within your risk parameters? Monthly, review all closed positions and calculate your win rate, average gain vs. average loss, and return by asset class. Quarterly, read back through your thesis entries and grade yourself on discipline.
Preguntas frecuentes
¿Por qué debo registrar una tesis de inversión con cada operación?
Escribir el razonamiento en el momento de la compra reduce el sesgo retrospectivo y facilita la revisión posterior. La SEC (2023, investor.gov, 'Investing Quick Tips') insta a los inversores a documentar decisiones y evitar operar por emociones. Kahneman, 'Thinking, Fast and Slow' (Farrar, Straus & Giroux, 2011) muestra que las decisiones registradas por escrito resisten la autojustificación posterior. La columna tesis de inversión hace que ese hábito sea operativo en cada fila. No constituye asesoramiento financiero.
¿Cómo uso la columna clase de activo para controlar la diversificación?
Etiquete cada operación por clase: acciones, ETFs, bonos, criptomonedas; luego sume el importe por clase mensualmente para detectar desviaciones en la asignación. La SEC (2023, investor.gov, 'Beginners' Guide to Asset Allocation') sitúa la diversificación como la disciplina central de gestión del riesgo. Combinar las columnas clase de activo y amount convierte el registro en un informe de asignación sin necesidad de software externo.
¿En qué se diferencia este diario de un extracto del bróker?
Los extractos del bróker muestran qué hizo usted; este diario registra por qué. Las nueve columnas —incluyendo tesis de inversión, fees y clase de activo— conservan la intención junto con la ejecución. La SEC (2023, investor.gov, 'Investor Bulletin: Keep Records') recomienda mantener registros personales independientes de los informes del bróker para la justificación fiscal y la revisión de decisiones, especialmente si opera en varias cuentas o plataformas.
¿Por qué necesito registrar las comisiones en cada entrada?
Las comisiones se acumulan y erosionan la rentabilidad más de lo que la mayoría de los inversores estima. La SEC (2014, 'Investor Bulletin: How Fees and Expenses Affect Your Investment Portfolio') muestra que una comisión anual del 1 % puede reducir el valor de la cartera en decenas de miles a lo largo de décadas. La columna fees obliga a tomar conciencia del coste en cada operación, no solo una vez al año al recibir el extracto.
¿Llevar un diario de inversión realmente mejora los resultados?
La documentación apoya el ciclo de práctica deliberada: registrar, revisar, perfeccionar. La CFPB (2022, 'Tools for Tracking Your Money') respalda los registros escritos para cualquier actividad financiera del hogar. Ningún diario garantiza rentabilidad, pero completar tesis de inversión y revisar entradas mensualmente contrarresta los sesgos de exceso de confianza y aversión a las pérdidas descritos en Kahneman, 'Thinking, Fast and Slow' (Farrar, Straus & Giroux, 2011). No constituye asesoramiento financiero.
¿Es este diario adecuado para inversores en ETFs y fondos indexados?
Sí. La columna clase de activo admite ETFs, fondos indexados, bonos y acciones individuales por igual. Incluso los inversores pasivos se benefician de registrar aportaciones y razonamientos: la SEC (2023, investor.gov, 'Mutual Funds and ETFs') recomienda revisiones periódicas de la asignación. Para inversores de baja frecuencia, la página de 12 filas cubre aproximadamente un año de aportaciones mensuales.
¿Qué errores frecuentes me ayuda a evitar este diario?
Dos grandes: perseguir rentabilidades pasadas y olvidar por qué compró. La SEC (2023, investor.gov, 'Investor Alerts') advierte que cambiar de estrategia basándose en rendimientos recientes destruye la rentabilidad a largo plazo. Completar el campo tesis de inversión obliga a escribir una justificación; revisarlo mensualmente expone errores recurrentes como sobreconcentración, ventas de pánico o comprar narrativas en lugar de fundamentales.
¿Con qué frecuencia debo revisar mis entradas del diario?
La revisión mensual es el ritmo adecuado para la mayoría de los inversores: con suficiente frecuencia para detectar desviaciones y suficiente espaciado para evitar el exceso de operaciones. La SEC (2023, investor.gov, 'Rebalancing Your Portfolio') sugiere comprobar la asignación en intervalos fijados en lugar de reaccionar a los movimientos del mercado. Con 12 filas por página, una página equivale aproximadamente a un ciclo de revisión.
También Te Puede Gustar
Rueda para ampliar, arrastra para mover