Printable Running Journal
Track every run, measure progress, and reach your goals
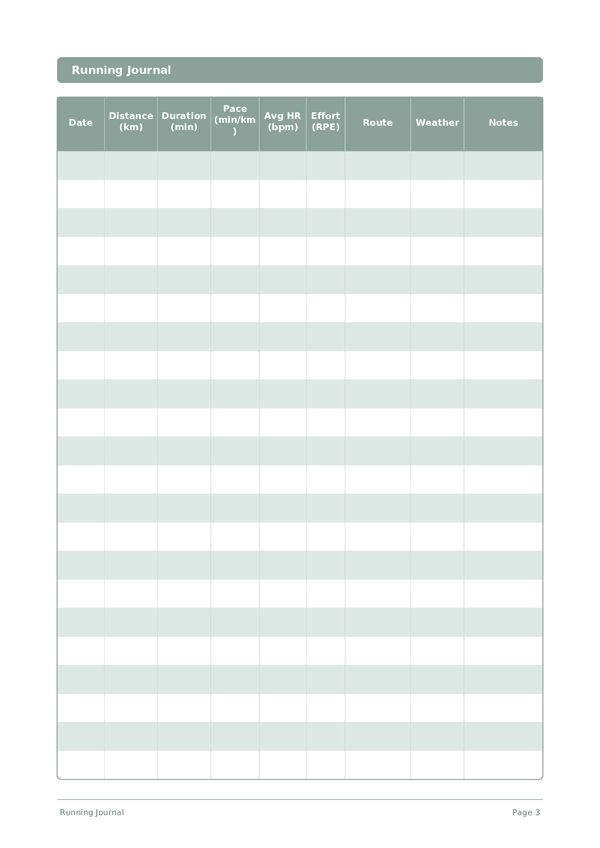
The Running Journal is a structured training log that helps you record key metrics for every run — distance, pace, heart rate, effort level, route, and more. Whether you are training for a race or building a consistent habit, this log gives you the data to analyse trends, identify patterns, and improve over time.
Customize fields
Toggle fields on or off. Click the pencil to rename, or add your own fields.
Benefits
How to Use
What is this journal?
A running journal is a dedicated log where you record the details of every run — distance, duration, pace, heart rate, effort level, route, and conditions. It transforms your running from a series of disconnected outings into a structured training history that reveals trends, celebrates progress, and helps you train smarter.
This journal is for runners of all levels: beginners building up to their first 5K, recreational joggers who want to stay consistent, and experienced runners training for marathons or ultras. It is also valuable for people returning to running after injury, as tracking effort levels and how your body responds helps you avoid doing too much too soon.
Experienced coaches will tell you that a running journal is one of the most important tools a runner can have. By looking back at weeks and months of data, you can see how your pace improves at a given heart rate, identify which training approaches work best for you, and spot warning signs of overtraining before they lead to injury. On days when motivation is low, flipping back through your journal and seeing how far you have come is one of the most powerful reminders of why you run.
Filled example
Here's what a typical entry looks like when filled in:
| Date | Distance (km) | Duration (min) | Pace (min/km) | Avg HR (bpm) | Effort (RPE) | Route | Weather | Notes |
|---|---|---|---|---|---|---|---|---|
| 2025-01-06 | 5.2 | 28 | 5:23/km | 148 | 6 | River path loop | Overcast, 4°C | Easy recovery run. Legs felt fresh after rest day. |
| 2025-01-08 | 8 | 40 | 5:00/km | 158 | 7 | Park circuit (2 laps) | Sunny, 2°C | Tempo run. Held pace well through km 6, then slowed slightly. |
| 2025-01-10 | 6.5 | 42 | 6:28/km | 135 | 4 | Neighborhood streets | Light rain, 6°C | Easy conversational pace. Practiced nasal breathing. |
| 2025-01-11 | 12 | 65 | 5:25/km | 155 | 8 | Lakeside trail | Cloudy, 3°C | Long run. Felt strong first 10 km, last 2 km were a grind. Fueled with gel at km 8. |
| 2025-01-13 | 5 | 23 | 4:36/km | 172 | 9 | Track (400m) | Clear, 1°C | Interval session: 5 x 1000m at 4:20 pace with 90s rest. Hit all splits. |
| 2025-01-14 | 4 | 24 | 6:00/km | 128 | 3 | Flat neighborhood loop | Overcast, 5°C | Shake-out run after hard intervals. Kept effort very low. |
How to fill in each field
Each page is a table with columns. Fill in one row per entry. Here's what each column is for:
Date
Write today's date. This anchors your entry in time and helps when reviewing entries later.
Distance (km)
Record the distance covered (in km or miles). Watching your distance increase over weeks is a powerful motivator.
Duration (min)
Record how long you exercised or practiced in minutes. Tracking duration helps you see your commitment grow and find your optimal session length.
Pace (min/km)
Note your pace (e.g., min/km or min/mile). Tracking pace alongside how you felt helps you find your sweet spot.
Avg HR (bpm)
Average heart rate in beats per minute
Effort (RPE)
Rate of perceived exertion: 1=very easy, 10=maximum effort
Route
Name of route, neighborhood, or trail
Weather
Sunny, cloudy, rain, wind — current conditions
Notes
Add any additional context or thoughts. This catch-all column is for anything that doesn't fit elsewhere but might be useful later.
Tips for success
When and how often to write
Log every run within 15 minutes of finishing, while the details are fresh. Even short recovery jogs deserve an entry — they reveal patterns in how your body responds to training load. At the end of each week, review your total volume and note how it compares to the previous week. A safe progression rule is no more than 10% weekly mileage increase. Monthly, look for pace-at-effort trends: the same heart rate producing faster splits is the clearest sign of fitness gains.
Frequently Asked Questions
Why log heart rate and RPE (effort) together for each run?
British Journal of Sports Medicine (2017, 51(20)) and the American College of Sports Medicine consensus show that pairing objective heart rate with subjective RPE detects fitness gains and overtraining better than either alone. When heart rate rises at the same RPE, fatigue is accumulating. When RPE drops at the same heart rate, aerobic capacity is improving. This template's two-column design supports both signals.
How do I calculate pace from distance and duration?
Pace (min/km) = duration ÷ distance. For a 5 km run in 30 minutes, pace is 6:00/km. The template provides distance, duration (min), and a dedicated pace column so you can verify the math. Medicine & Science in Sports & Exercise (2019, 51(4)) notes that consistent pace tracking across weeks reveals aerobic fitness trends invisible in single workouts.
What does the RPE 1-10 scale actually mean?
The Borg CR-10 scale, used by ACSM and British Journal of Sports Medicine, anchors 1 as 'very light' (warm-up jog), 5 as 'somewhat hard' (conversational tempo), 7 as 'hard' (threshold), and 10 as 'maximum effort.' Most weekly mileage should be at RPE 3-5 (easy aerobic). Reserving RPE 7+ for one or two sessions per week reduces injury risk per the 80/20 polarized-training literature.
How many runs per week is enough to see progress?
USPSTF and the WHO Physical Activity Guidelines (2020) recommend 150 minutes of moderate aerobic activity weekly. For running specifically, ACSM suggests 3-5 sessions per week with at least one rest day. Beginners can progress on 3 runs; intermediate runners typically log 4-5. Use the journal's weekly totals to verify volume: total kilometers and minutes are the variables that drive most adaptations.
What heart rate range should easy runs sit in?
About 60-70% of max heart rate, per ACSM. Estimate max as 220 minus age (a rough formula; actual values vary). For a 40-year-old, max is roughly 180 bpm, so the easy zone is 108-126 bpm. British Journal of Sports Medicine reviews show 75-80% of weekly mileage should be in this 'conversational' zone. Use the avg HR (bpm) column to verify you're not pushing easy days too hard.
How can the journal help me avoid overtraining injuries?
British Journal of Sports Medicine (2016, 50(17)) shows acute-to-chronic workload ratios above 1.5 sharply raise injury risk. Track weekly distance totals and compare to your 4-week rolling average; increases over 10% per week are warning signs. Rising heart rate at unchanged pace, plus rising RPE, signal accumulating fatigue. The notes column is the right place to flag aches and fatigue early.
How is this journal different from Strava or Garmin Connect?
GPS apps automate distance and heart rate but rarely capture qualitative context. The notes and weather columns let you record headwinds, hill profiles, sleep quality, and fueling: variables that explain a slow run when raw data alone looks like fitness loss. NIH NCCIH (2022) behavior-change research shows handwritten review during the cooldown improves adherence and self-assessment more than passive dashboards.
Should I log easy runs and warm-ups, or only key workouts?
Log everything. ACSM and Medicine & Science in Sports & Exercise emphasize total training load, not just hard sessions. Easy runs comprise the bulk of weekly volume and drive aerobic adaptations. Skipping them in your log understates load and obscures the easy/hard balance ratio. A single template row per run, even 20-minute recovery jogs, keeps the picture complete.
You Might Also Like
Scroll to zoom, drag to move