Printable Trading Journal
Trade logging and performance analysis journal
Improve your trading edge with meticulous trade documentation, risk management tracking, and performance analysis. Identify patterns in your wins and losses to become a consistently profitable trader.
Customize fields
Toggle fields on or off. Click the pencil to rename, or add your own fields.
What is this journal?
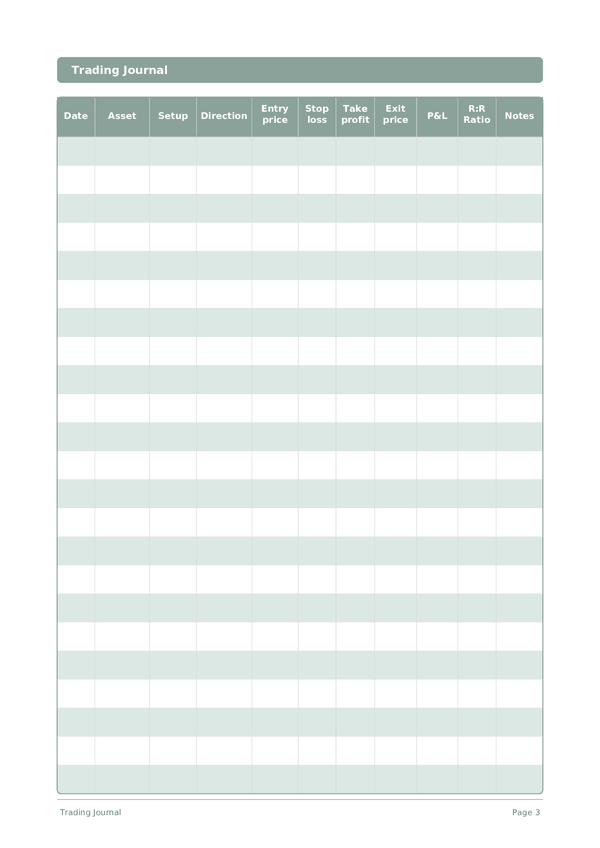
A Trading Journal is an essential record-keeping tool for anyone who trades stocks, options, forex, or crypto. Each row captures the date, asset traded, setup type, direction, entry price, stop loss, take profit, exit price, profit or loss, risk-to-reward ratio, and notes. By logging every trade, you build a personal dataset that reveals your true edge — or exposes costly patterns you need to fix.
Professional traders universally agree that journaling is one of the highest-leverage habits for improving performance. Without a journal, it is impossible to know whether your strategy is genuinely profitable or whether recent gains are just luck. A well-kept trading log lets you calculate your win rate, average gain-to-loss ratio, and performance by setup type, time of day, or market conditions.
Log every trade immediately after closing the position — not at the end of the week when details have faded. Record your rationale in the notes column: what did the setup look like, what was your thesis, and what emotion did you feel when entering? Review your journal weekly to identify which setups are working and which you should stop trading.
Filled example
Here's what a typical entry looks like when filled in:
| Date | Asset | Setup | Direction | Entry price | Stop loss | Take profit | Exit price | P&L | R:R Ratio | Notes |
|---|---|---|---|---|---|---|---|---|---|---|
| 2025-01-06 | AAPL | Breakout | Long | 248.5 | 245 | 255 | 254.2 | 570 | 1.63 | Clean break above resistance on volume |
| 2025-01-06 | EUR/USD | Pullback | Short | 1.0385 | 1.041 | 1.034 | 1.0342 | 430 | 1.72 | Bearish engulfing on 4H after news catalyst |
| 2025-01-07 | TSLA | Gap fill | Long | 395 | 390 | 405 | 392.1 | -290 | -0.58 | Stopped out early — gap did not hold support |
| 2025-01-08 | BTC/USD | Range break | Long | 97200 | 96000 | 100000 | 99400 | 1100 | 1.83 | Broke 12-day consolidation range on high volume |
| 2025-01-08 | NVDA | Momentum | Long | 148.3 | 146.5 | 152 | 147 | -195 | -0.72 | Entered too late in the move, weak follow-through |
How to fill in each field
Each page is a table with columns. Fill in one row per entry. Here's what each column is for:
Date
Write today's date. This anchors your entry in time and helps when reviewing entries later.
Asset
Setup
Direction
Entry price
Stop loss
Take profit
Exit price
P&L
R:R Ratio
Notes
Add any additional context or thoughts. This catch-all column is for anything that doesn't fit elsewhere but might be useful later.
Tips for success
When and how often to write
Make a journal entry for every trade — before, during, and after. Before: write your thesis, setup, and planned risk parameters. During: note any deviations from the plan. After: record the outcome, what went right, and what you would do differently. On non-trading days, spend 15 minutes reviewing recent trades and updating your statistics. Weekly, calculate your win rate, average R-multiple, and largest drawdown. Monthly, identify your top three setups by profitability and your worst three by loss — then trade more of the former and less of the latter.