Printable Weather Journal
Daily weather observations for amateur meteorologists
A structured daily log for anyone who wants to track local weather conditions with precision and consistency. Record temperature, humidity, sky condition, precipitation, wind, and cloud cover each day to build a meaningful personal climate record. Over weeks and months, patterns emerge — seasonal shifts, microclimatic quirks, and correlations with everyday life become visible.
Customize fields
Toggle fields on or off. Click the pencil to rename, or add your own fields.
Benefits
How to Use
What is this journal?
A weather journal is a daily tracker for recording local weather conditions with precision. By logging temperature, humidity, sky conditions, and precipitation each day, you build a hyperlocal climate record that reveals seasonal patterns, microclimates, and long-term trends that official weather stations may miss.
This journal is for weather enthusiasts, gardeners, photographers, outdoor planners, and anyone fascinated by the ever-changing atmosphere. It is also valuable for documenting how weather affects your mood, energy, and activities — creating a personal weather-life correlation record.
Citizen weather observation has a long and valuable history in meteorology. Your daily records contribute to understanding local climate patterns that coarse-grained weather data cannot capture. Over years, this journal becomes a personal almanac — telling you exactly when your area's seasons shift, which weeks bring the best light for photography, and how your garden's microclimate differs from the nearest weather station.
Filled example
Here's what a typical entry looks like when filled in:
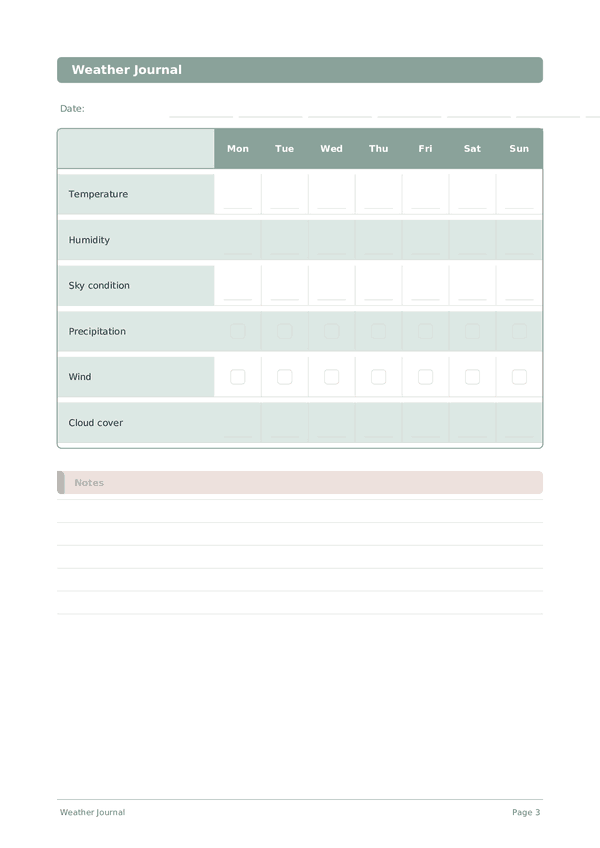
| Mon | Tue | Wed | Thu | Fri | Sat | Sun | |
|---|---|---|---|---|---|---|---|
| Temperature | 8 | 11 | 14 | 12 | 9 | 7 | 10 |
| Humidity | 72 | 65 | 58 | 70 | 78 | 82 | 68 |
| Sky condition | Overcast | Partly sunny | Clear | Cloudy | Rain | Fog AM, clear PM | Partly cloudy |
| Precipitation | ✓ | ✓ | |||||
| Wind | ✓ | ✓ | ✓ | ||||
| Cloud cover | 9 | 5 | 1 | 7 | 10 | 6 | 4 |
How to fill in each field
Each page is a weekly grid. Rows are your tracking items, columns are days of the week. Here's what each item means:
Temperature
Record your basal body temperature. Temperature shifts help track ovulation and overall cycle health.
Humidity
Sky condition
What does the sky look like right now? Describe clouds, clarity, or weather
Precipitation
Wind
Cloud cover
Tips for success
When and how often to write
Record observations at the same time every day without exception \u2014 consistency is the foundation of meaningful weather data. Morning readings capture overnight changes; afternoon readings capture the day\u2019s peak conditions. A twice-daily habit takes under 2 minutes each time. Weekly, scan your entries for developing patterns. Monthly and seasonally, compare this period to the same period in previous years. After one full year, your data becomes a genuine reference for your local microclimate.
Frequently Asked Questions
Why log weather manually when forecasts and apps exist?
Forecasts predict regional averages; this journal records your exact microclimate. Cooperative Extension and citizen-science programs like CoCoRaHS rely on volunteer manual readings precisely because automated stations miss local variation. Hilltops, valleys, and shaded gardens diverge from official airport data by several degrees. A daily personal log builds an accurate climate baseline no commercial app provides.
What time of day should I take my readings?
Consistency matters more than the exact hour. Cooperative Observer Program guidance and CoCoRaHS recommend the same time daily — typically morning between 7-9 a.m. — so multi-day comparisons stay valid. The journal doesn't print a time slot, precisely so you choose what fits your schedule, then hold it. Drifting times produce noisy data; consistent times produce signal.
How do I estimate humidity without a sensor?
Visual cues approximate it: heavy dew, fogged windows, and clinging clothing suggest 80%+ relative humidity; static electricity and cracking lips suggest below 40%. For accuracy, a basic hygrometer costs little and pairs naturally with this journal. The how to use note suggests sensor-free estimation precisely so the journal stays useful before you invest in instruments.
How does the 1-10 cloud cover rating work?
It mirrors the international okta scale used by meteorological services worldwide, which measures sky coverage in eighths. Translated to 1-10: 1 = clear blue, 5 = scattered cumulus, 8 = mostly overcast, 10 = full cloud deck. Daily ratings reveal sunshine trends and let you correlate cloud days with mood, garden growth, or solar yield if you have panels.
How long until I see meaningful patterns?
A full calendar year captures one cycle of seasons. Three years allows comparison — was this April warmer than the last two? Cooperative Observer Program data conventions treat 30-year records as climate normals, but personal weather journaling becomes useful at the one-year mark and visibly valuable from year three onward, especially for gardeners and outdoor athletes.
Can my logged data correlate with mood or health?
Many people perceive a connection. Research on seasonal affective disorder and weather sensitivity exists, but findings are mixed and individual. Logging cloud cover, precipitation, and your subjective state in parallel (in a separate mood column or sticky note) lets you check your own pattern. This is observational self-knowledge, not diagnosis — consult a clinician for persistent mood symptoms.
How is this different from automated home weather stations?
Stations log temperature and humidity automatically but generate noisy data nobody reviews. The journal forces a daily 60-second pause to look at the sky, note conditions, and rate cloud cover — observations no sensor captures. Many enthusiasts run both: the station logs precise numbers, the journal builds the human-readable narrative and your meteorological eye over time.
Should I include unusual events like storms or first frost?
Yes — make them prominent. Cooperative Observer Program guidance treats first frost, last frost, severe storms, and extreme highs/lows as headline data points. Underline or asterisk these entries so they stand out when you flip back. Gardeners especially rely on multi-year frost dates; outdoor athletes track storm frequency and dry-spell length for activity planning.
You Might Also Like
Scroll to zoom, drag to move