Printable Period Journal
Menstrual cycle tracker and symptom log
Track your menstrual cycle with detailed symptom logging, mood and energy patterns, and phase awareness. Build a comprehensive picture of your cycle for better health and self-understanding.
Personalizar campos
Activa o desactiva campos. Haz clic en el lápiz para renombrar, o añade tus propios campos.
¿Qué es este diario?
A period journal is a daily tracker where you record the details of your menstrual cycle — cycle day, flow intensity, pain levels, mood, energy, and common symptoms like bloating, cravings, and headaches. By tracking these patterns consistently cycle after cycle, you develop a deep understanding of your body's rhythms that no app algorithm can replicate, because it is grounded in your own lived experience.
This journal is for anyone who menstruates and wants to understand their cycle better. Whether you are trying to predict your period more accurately, manage painful symptoms, prepare for hormonal shifts that affect your mood and energy, or gather data to share with a gynecologist, this tracker gives you a structured and private space to record it all.
Many people are surprised by what their period journal reveals. You might discover that your energy peaks during the follicular phase, that headaches reliably appear two days before your period, or that cravings are strongest on specific cycle days. This knowledge is empowering — it allows you to plan demanding tasks for your high-energy days, prepare for symptom management before symptoms start, and have informed conversations with healthcare providers about your menstrual health.
Ejemplo completado
Así es como se ve una entrada típica cuando se rellena:
| Mon | Tue | Wed | Thu | Fri | Sat | Sun | |
|---|---|---|---|---|---|---|---|
| Día del ciclo | 1 | 2 | 3 | 4 | 5 | 6 | 7 |
| Fase del Ciclo | Menstrual | Menstrual | Menstrual | Menstrual | Menstrual | Follicular | Follicular |
| Intensidad del Flujo | 3 | 8 | 7 | 5 | 3 | 1 | 0 |
| Nivel de dolor (1-10) | 7 | 6 | 4 | 3 | 2 | 1 | 0 |
| Estado de ánimo (1-10) | 4 | 5 | 5 | 6 | 6 | 7 | 8 |
| Nivel de energía (1-10) | 3 | 4 | 4 | 5 | 6 | 7 | 8 |
| Hinchazón | ✓ | ✓ | ✓ | ✓ | |||
| Antojos | ✓ | ✓ | ✓ | ||||
| Dolor de cabeza | ✓ | ||||||
| Notas | First day, heavy cramps in the morning. Took ibuprofen. | Heaviest day. Stayed home. Hot water bottle helped. | Flow easing. Mild cramps in the evening. | Much lighter. Energy starting to return. | Spotting only. Felt almost normal. | Period basically over. Good energy. | Feeling great. Went for a run. |
Cómo rellenar cada campo
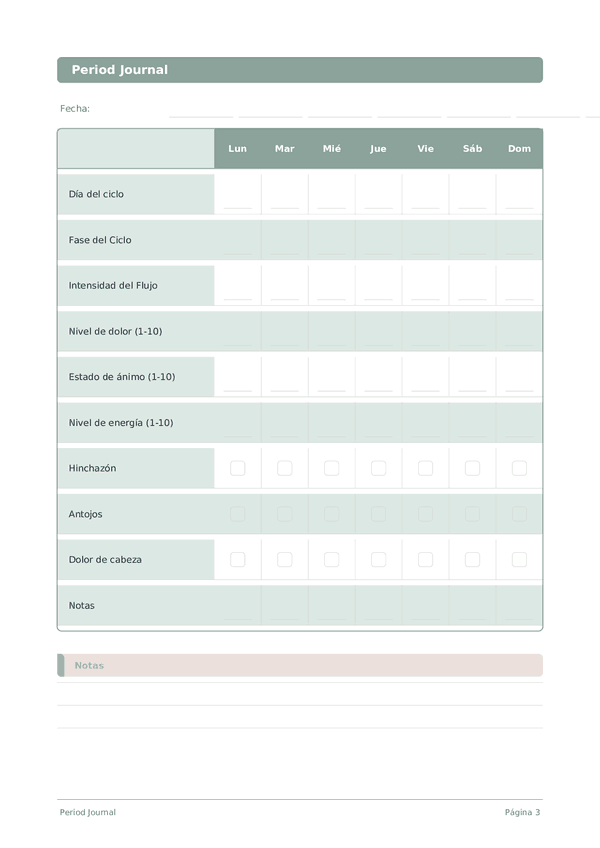
Cada pagina es una cuadricula semanal. Las filas son tus elementos de seguimiento, las columnas son los dias de la semana. Esto es lo que significa cada elemento:
Día del ciclo
Registra en que dia del ciclo estas. El seguimiento consistente ayuda a predecir futuros ciclos e identificar irregularidades.
Fase del Ciclo
Intensidad del Flujo
Nivel de dolor (1-10)
Califica la intensidad de tu dolor en una escala. Rastrear los niveles de dolor ayuda a identificar desencadenantes, evaluar tratamientos y comunicarte con los profesionales de salud.
Estado de ánimo (1-10)
Califica tu estado emocional general del dia. 1 significa muy bajo o deprimido, 10 significa excepcionalmente feliz y positivo. No lo pienses demasiado: ve con tu instinto.
Nivel de energía (1-10)
Califica tu nivel de energia fisica y mental. 1 significa agotado y sin fuerzas, 10 significa totalmente energizado y alerta. Esto te ayuda a identificar que actividades aumentan o agotan tu energia.
Hinchazón
Antojos
Dolor de cabeza
Notas
Agrega cualquier contexto o pensamiento adicional. Esta columna general es para cualquier cosa que no encaje en otro lugar pero pueda ser util despues.
Consejos para el exito
Cuando y con que frecuencia escribir
Mark flow and symptoms every day during your period, and note any mid-cycle symptoms (ovulation pain, spotting, discharge changes) as they occur. On non-event days, a quick daily check-in about mood and energy still provides valuable cycle data. At the end of each cycle, review the full pattern. After 3 months, you will be able to predict symptom onset and prepare accordingly. Share tracked data with your gynecologist at annual checkups for more productive appointments.
Preguntas frecuentes
¿Por qué registrar la fase del ciclo junto con el día del ciclo?
El ACOG (2015, confirmado en 2022) recomienda registrar ambos porque la fase revela el contexto hormonal, mientras que el día permite la predicción. Las cuatro fases —menstrual, folicular, ovulatoria, lútea— generan cambios predecibles en el ánimo, la energía, el dolor y el hinchazón, según los datos de referencia del NIH NICHD. Saber que está en la fase lútea explica los síntomas premenstruales; registrar ambos campos permite al ginecólogo correlacionar las quejas con la ventana hormonal relevante.
¿Qué se considera una duración y un flujo 'normales' del ciclo?
El ACOG define como normal los ciclos de 21-35 días con hemorragia de 2-7 días. La hemorragia menstrual abundante (menorragia) es generalmente >80 ml en total, o empapar una compresa u tampón cada hora. La escala de intensidad del flujo 0-10 capta cambios subjetivos a lo largo del tiempo de forma más útil que el volumen absoluto. Los ciclos persistentemente fuera de este rango, o los cambios repentinos, merecen evaluación por un ginecólogo.
¿Cómo ayuda este diario a diagnosticar afecciones como el SOP o la endometriosis?
Los ginecólogos usan 3-6 meses de datos del ciclo para identificar patrones que sugieren SOP (ciclos irregulares, a menudo >35 días), endometriosis (dolor grave ≥7/10, especialmente durante la menstruación), PMDD (puntuaciones de ánimo 7+ días antes del período) o fibromas (flujo abundante). El ACOG y la NICE se apoyan en los diarios de las pacientes para el diagnóstico diferencial. Las valoraciones de nivel de dolor (1-10) y intensidad del Flujo, combinadas con las puntuaciones de ánimo, dan a su médico evidencia más allá de una sola visita.
¿Qué revelan las casillas de hinchazón, antojos y dolor de cabeza?
Son síntomas centrales del síndrome premenstrual (SPM) según los criterios del NIH NICHD. La APA define el PMDD cuando 5+ síntomas se agrupan en la fase lútea durante la mayoría de los ciclos. Marcarlos durante 2-3 ciclos revela si los síntomas son consistentemente cíclicos (SPM/PMDD) o aleatorios. Esta distinción importa para el tratamiento: los ISRS ayudan en el PMDD; las intervenciones de estilo de vida ayudan en el SPM leve, según las guías del ACOG.
¿En qué se diferencia de apps de seguimiento como Clue o Flo?
Las apps almacenan y predicen; los diarios en papel fomentan la reflexión. Muchas apps de seguimiento comparten datos con terceros, una preocupación de privacidad señalada por el HHS y la FTC. El formato en papel mantiene los datos menstruales completamente privados. Las valoraciones 0-10 aquí permiten también un seguimiento de síntomas más matizado que las casillas binarias de la mayoría de las apps. Use ambos si le resulta útil: papel para las notas sensibles, app para la predicción.
¿Puedo rastrear ciclos perimenopáusicos con este diario?
Sí. La NIA y el ACOG describen la perimenopausia (típicamente entre 45-55 años) por ciclos irregulares, sofocos y cambios de humor. Las valoraciones de intensidad del Flujo, ánimo y energía capturan bien esta transición; día del ciclo sigue siendo útil aunque los ciclos se alarguen. Lleve 6+ meses de datos a su ginecólogo si los ciclos se vuelven consistentemente >35 días o saltan meses: ayuda a determinar la etapa de la transición menopáusica y a descartar otras causas.
¿Cuánto tiempo hasta que los patrones sean útiles?
El ACOG recomienda 3 ciclos completos para la caracterización basal, y 6 ciclos para detectar trastornos cíclicos como el PMDD. El primer mes a menudo revela poco porque la identificación de la fase depende de conocer el inicio del siguiente período. Tras 3 ciclos, la duración media del ciclo, los patrones de ovulación (a través de los cambios de energía y ánimo a mitad del ciclo) y la agrupación de síntomas se vuelven claros. El diagnóstico fiable de SPM/PMDD requiere al menos 2 ciclos registrados prospectivamente.
¿Cuándo deben los cambios del ciclo motivar una visita al médico?
Señales de alarma del ACOG y Mayo Clinic: ciclos consistentemente más cortos de 21 o más largos de 35 días, hemorragia de más de 7 días, flujo muy abundante (empapar compresas cada hora), dolor grave que no responde a analgésicos sin receta, hemorragia entre períodos o cambios repentinos del ciclo. Lleve al menos 3 ciclos de datos. La ausencia repentina de menstruación requiere prueba de embarazo y evaluación si este queda descartado.
También Te Puede Gustar
Rueda para ampliar, arrastra para mover