Printable Trading Journal
Trade logging and performance analysis journal
Improve your trading edge with meticulous trade documentation, risk management tracking, and performance analysis. Identify patterns in your wins and losses to become a consistently profitable trader.
Personalizar campos
Activa o desactiva campos. Haz clic en el lápiz para renombrar, o añade tus propios campos.
¿Qué es este diario?
A Trading Journal is an essential record-keeping tool for anyone who trades stocks, options, forex, or crypto. Each row captures the date, asset traded, setup type, direction, entry price, stop loss, take profit, exit price, profit or loss, risk-to-reward ratio, and notes. By logging every trade, you build a personal dataset that reveals your true edge — or exposes costly patterns you need to fix.
Professional traders universally agree that journaling is one of the highest-leverage habits for improving performance. Without a journal, it is impossible to know whether your strategy is genuinely profitable or whether recent gains are just luck. A well-kept trading log lets you calculate your win rate, average gain-to-loss ratio, and performance by setup type, time of day, or market conditions.
Log every trade immediately after closing the position — not at the end of the week when details have faded. Record your rationale in the notes column: what did the setup look like, what was your thesis, and what emotion did you feel when entering? Review your journal weekly to identify which setups are working and which you should stop trading.
Ejemplo completado
Así es como se ve una entrada típica cuando se rellena:
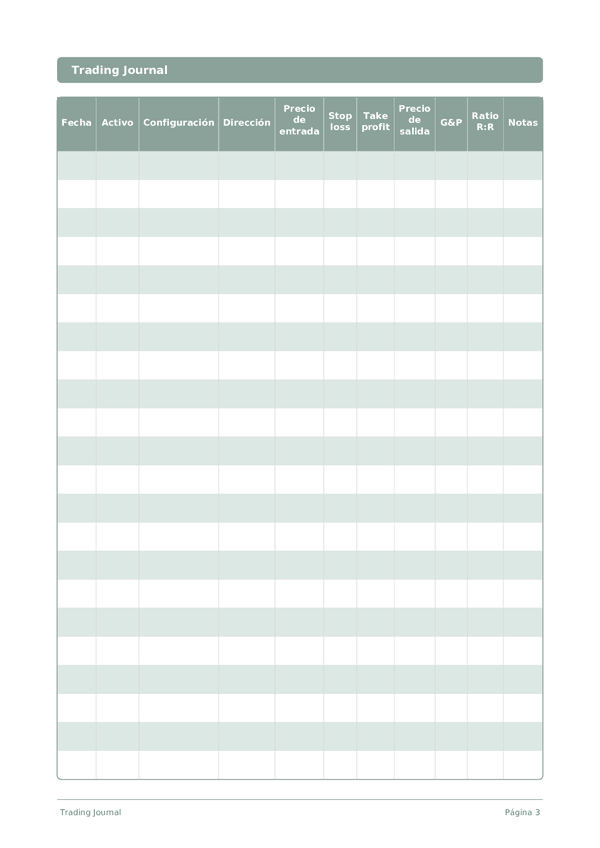
| Fecha | Activo | Configuración | Dirección | Precio de entrada | Stop loss | Take profit | Precio de salida | G&P | Ratio R:R | Notas |
|---|---|---|---|---|---|---|---|---|---|---|
| 2025-01-06 | AAPL | Breakout | Long | 248.5 | 245 | 255 | 254.2 | 570 | 1.63 | Clean break above resistance on volume |
| 2025-01-06 | EUR/USD | Pullback | Short | 1.0385 | 1.041 | 1.034 | 1.0342 | 430 | 1.72 | Bearish engulfing on 4H after news catalyst |
| 2025-01-07 | TSLA | Gap fill | Long | 395 | 390 | 405 | 392.1 | -290 | -0.58 | Stopped out early — gap did not hold support |
| 2025-01-08 | BTC/USD | Range break | Long | 97200 | 96000 | 100000 | 99400 | 1100 | 1.83 | Broke 12-day consolidation range on high volume |
| 2025-01-08 | NVDA | Momentum | Long | 148.3 | 146.5 | 152 | 147 | -195 | -0.72 | Entered too late in the move, weak follow-through |
Cómo rellenar cada campo
Cada pagina es una tabla con columnas. Completa una fila por entrada. Esto es lo que significa cada columna:
Fecha
Escribe la fecha de hoy. Esto ancla tu entrada en el tiempo y ayuda cuando revisas entradas despues.
Activo
Configuración
Dirección
Precio de entrada
Stop loss
Take profit
Precio de salida
G&P
Ratio R:R
Notas
Agrega cualquier contexto o pensamiento adicional. Esta columna general es para cualquier cosa que no encaje en otro lugar pero pueda ser util despues.
Consejos para el exito
Cuando y con que frecuencia escribir
Make a journal entry for every trade — before, during, and after. Before: write your thesis, setup, and planned risk parameters. During: note any deviations from the plan. After: record the outcome, what went right, and what you would do differently. On non-trading days, spend 15 minutes reviewing recent trades and updating your statistics. Weekly, calculate your win rate, average R-multiple, and largest drawdown. Monthly, identify your top three setups by profitability and your worst three by loss — then trade more of the former and less of the latter.
Preguntas frecuentes
¿Por qué debo registrar precio de entrada, stop loss y take profit antes de que se cierre la operación?
Los planes previos a la operación revelan la disciplina de ejecución tras ella. La SEC (2023, investor.gov, 'Day Trading') advierte que la mayoría de los operadores activos pierden dinero, a menudo porque el plan se desvía durante la operación. Escribir stop loss y take profit en la entrada crea el único registro honesto de si siguió su plan. Sin él, el sesgo retrospectivo reescribe cada operación como intencional y el aprendizaje se detiene. No constituye asesoramiento financiero.
¿Cómo calculo la columna ratio R:R?
La ratio riesgo-beneficio es (take profit menos precio de entrada) dividido por (precio de entrada menos stop loss) para una operación larga, con los signos invertidos para las cortas. La SEC (2023, investor.gov, 'Trading Basics') enmarca la gestión del riesgo como la disciplina central del trading activo. Registrar ratio R:R por operación le permite comprobar si su tipo de setup realmente logra la relación riesgo-beneficio que asume al dimensionar posiciones.
¿Para qué sirve realmente la columna setup?
Una etiqueta corta para el patrón recurrente que operó: ruptura, reversión a la media, noticias, cierre de gap. La SEC (2023, investor.gov, 'Investor Bulletin: Day Trading') señala que los operadores activos raramente etiquetan sus setups y por eso no pueden evaluar qué enfoques funcionan. Las etiquetas consistentes convierten una lista de operaciones en un conjunto de datos ordenable; tras 50-100 operaciones, los patrones de pnl por setup revelan su ventaja real, o la falta de ella.
¿En qué se diferencia este diario de los extractos del bróker o las notas de TradingView?
Los datos del bróker muestran la ejecución; este diario registra la intención más la ejecución. La SEC (2023, investor.gov, 'Investor Bulletin: Keep Records') recomienda registros personales de operaciones independientes de los informes del bróker. Las 11 columnas —incluyendo setup, direction, stop loss, take profit, ratio R:R y notes— capturan el contexto de decisión que los extractos del bróker omiten. Sin ese contexto, el aprendizaje posterior colapsa en atribución de suerte.
¿Llevar un diario de trading mejora realmente el rendimiento?
La documentación apoya el ciclo de práctica deliberada que la SEC recomienda repetidamente para cualquier inversor. La SEC (2023, investor.gov, 'Day Trading') afirma que la mayoría de los day traders pierden dinero; la revisión estructurada es una de las prácticas documentadas que distinguen a los que sobreviven. Daniel Kahneman, 'Thinking, Fast and Slow' (Farrar, Straus & Giroux, 2011) muestra que la memoria retrospectiva de las operaciones está sistemáticamente sesgada hacia reconstrucciones favorables.
¿Qué va en la columna notes para una operación típica?
Por qué tomó la operación más allá de la etiqueta del setup, el contexto del mercado, el estado emocional y lo que le sorprendió. Daniel Kahneman, 'Thinking, Fast and Slow' (Farrar, Straus & Giroux, 2011) describe cómo el contexto emocional genera errores de ejecución invisibles en los datos de precio. Las notas breves capturadas al cerrar hacen que la revisión posterior sea honesta; las notas reconstruidas están sistemáticamente sesgadas hacia el resultado que ocurrió.
¿Debo registrar las operaciones perdedoras o solo las ganadoras?
Las perdedoras, especialmente. La SEC (2023, investor.gov, 'Day Trading') advierte que la mayoría de los operadores activos pierden, lo que convierte el análisis de pérdidas en la principal fuente de mejora de la ventaja. Rellenar cada fila —precio de entrada, stop loss, precio de salida, pnl— especialmente cuando pnl es negativo construye el conjunto de datos que expone las violaciones de reglas y los fallos de setup. Un diario selectivo produce un conjunto de datos halagador e inútil.
¿Cuántas operaciones debo registrar antes de revisar?
Revise semanalmente para la disciplina de ejecución; revise por setup tras unas 20-30 operaciones para obtener señal estadística. La SEC (2023, investor.gov, 'Investor Bulletin: Day Trading') subraya que las muestras pequeñas son engañosas. Con 15 operaciones por página, un swing trader cubre meses; un day trader activo, una semana. Adapte el ritmo de revisión a la frecuencia de entradas, no al calendario.
También Te Puede Gustar
Rueda para ampliar, arrastra para mover