Printable Diario del Ciclo Mestruale
Tracker del ciclo mestruale e registro dei sintomi
Personalizza campi
Attiva o disattiva i campi. Clicca la matita per rinominare, oppure aggiungi i tuoi campi.
Cos'è questo diario?
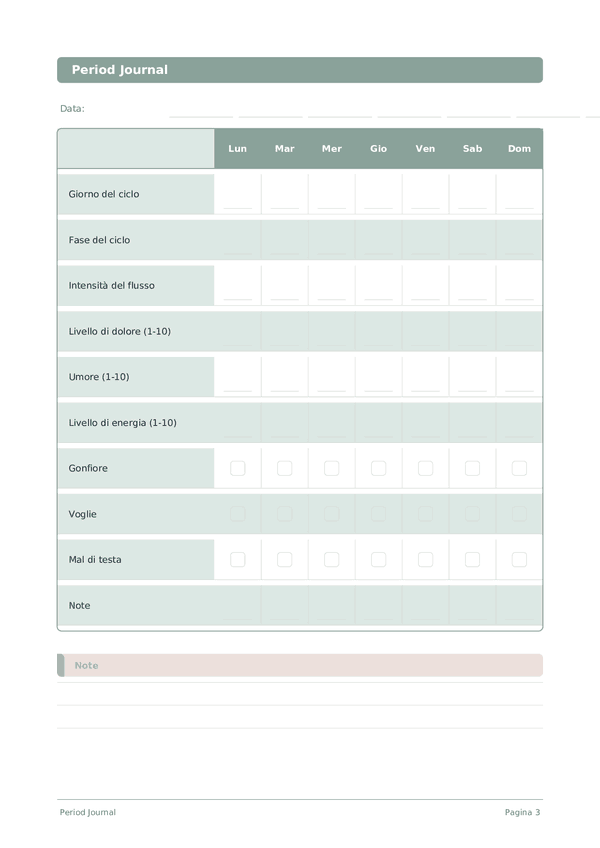
Questo è un diario di monitoraggio settimanale — una griglia visiva in cui segni le abitudini, valuti le tue metriche o spunti i compiti giorno per giorno. Ogni pagina copre una settimana, rendendo facile individuare schemi e costruire coerenza.
Come compilare ogni campo
Ogni pagina è una griglia settimanale. Le righe sono i tuoi elementi da monitorare, le colonne sono i giorni della settimana. Ecco cosa significa ogni elemento:
Giorno del ciclo
Registra a quale giorno del tuo ciclo sei. Un monitoraggio coerente aiuta a prevedere i cicli futuri e identificare irregolarità.
Fase del ciclo
Intensità del flusso
Livello di dolore (1-10)
Valuta l'intensità del dolore su una scala. Monitorare i livelli di dolore aiuta a identificare i trigger, valutare i trattamenti e comunicare con i professionisti sanitari.
Umore (1-10)
Valuta il tuo stato emotivo complessivo della giornata. 1 significa molto basso o depresso, 10 significa eccezionalmente felice e positivo. Non pensarci troppo — vai con la tua sensazione istintiva.
Livello di energia (1-10)
Valuta il tuo livello di energia fisica e mentale. 1 significa esausto e svuotato, 10 significa pieno di energia e sveglio. Questo ti aiuta a identificare quali attività aumentano o drenano la tua energia.
Gonfiore
Voglie
Mal di testa
Note
Aggiungi qualsiasi contesto o pensiero aggiuntivo. Questa colonna tuttofare è per tutto ciò che non si adatta altrove ma potrebbe essere utile in seguito.
Consigli per il successo
Quando e con quale frequenza scrivere
Segna il tracker ogni sera prima di dormire. Richiede meno di un minuto. Alla fine di ogni settimana, prenditi 5 minuti per rivedere la griglia e notare gli schemi. Ogni mese, sfoglia tutte le settimane per vedere il tuo arco di progresso.
Domande frequenti
Perché monitorare la fase del ciclo insieme al giorno del ciclo?
ACOG (2015, riaffermato 2022) raccomanda di registrare entrambi perché la fase rivela il contesto ormonale, mentre il giorno consente la previsione. Le quattro fasi — mestruale, follicolare, ovulatoria, luteale — guidano cambiamenti prevedibili nell'umore, nell'energia, nel dolore e nel gonfiore, secondo i dati di riferimento NIH NICHD. Sapere di essere nella fase luteale spiega i sintomi premestruali; registrare entrambi i campi consente al tuo ginecologo di correlare i disturbi con la finestra ormonale pertinente.
Cosa si intende per durata e flusso del ciclo 'normali'?
L'ACOG definisce normale un ciclo di 21–35 giorni con 2–7 giorni di sanguinamento. Il sanguinamento mestruale abbondante (menorragia) è generalmente superiore a 80 ml totali, o l'assorbimento di un assorbente/tampone ogni ora. La scala di intensità del flusso 0–10 cattura i cambiamenti soggettivi nel tempo in modo più utile del volume assoluto. Cicli persistentemente al di fuori di questo range, o cambiamenti improvvisi, richiedono una valutazione da parte di un ginecologo.
Come aiuta questo diario nella diagnosi di condizioni come la PCOS o l'endometriosi?
I ginecologi usano 3–6 mesi di dati del ciclo per identificare pattern che suggeriscono PCOS (cicli irregolari, spesso >35 giorni), endometriosi (dolore grave ≥7/10, specialmente durante le mestruazioni), PMDD (punteggi dell'umore elevati per 7+ giorni prima del ciclo) o fibromi (flusso abbondante). Sia ACOG che NICE si affidano ai diari dei pazienti per la diagnosi differenziale. Le valutazioni del livello di dolore e dell'intensità del flusso, combinate con i punteggi dell'umore, forniscono al tuo medico evidenze che vanno oltre un singolo appuntamento.
Cosa rivelano nel tempo le caselle per gonfiore, voglie e cefalea?
Sono i sintomi principali della sindrome premestruale (PMS) secondo i criteri NIH NICHD. L'APA definisce la PMDD quando 5 o più sintomi si raggruppano nella fase luteale per la maggior parte dei cicli. Spuntarli per 2–3 cicli rivela se i sintomi sono costantemente ciclici (PMS/PMDD) o casuali. Questa distinzione è importante per il trattamento — gli SSRI aiutano la PMDD; gli interventi sullo stile di vita aiutano la PMS lieve, secondo le linee guida ACOG.
Qual è la differenza rispetto a un'app come Clue o Flo?
Le app archiviano e prevedono; i diari cartacei favoriscono la riflessione. Molte app di monitoraggio condividono i dati con terze parti — una preoccupazione per la privacy segnalata da HHS e dalla FTC. Il formato cartaceo mantiene completamente privati i dati mestruali. Le valutazioni 0–10 qui permettono anche un monitoraggio dei sintomi più dettagliato rispetto alle caselle binarie della maggior parte delle app. Usa entrambe se utile — la versione cartacea per le note sensibili, l'app per le previsioni.
Posso monitorare i cicli perimenopausali con questo diario?
Sì. NIA e ACOG descrivono la perimenopausa (tipicamente tra i 45 e i 55 anni) con cicli di durata irregolare, vampate di calore e alterazioni dell'umore. Le valutazioni dell'intensità del flusso, dell'umore e dell'energia catturano bene questa transizione; il giorno del ciclo rimane utile anche quando i cicli si allungano. Porta 6+ mesi di dati al tuo ginecologo se i cicli diventano costantemente >35 giorni o si saltano dei mesi — questo aiuta a determinare la fase della transizione menopausale ed escludere altre cause.
Quanto tempo ci vuole perché i pattern di monitoraggio diventino utili?
L'ACOG raccomanda 3 cicli completi per la caratterizzazione di base e 6 cicli per rilevare disturbi ciclici come la PMDD. Il primo mese spesso rivela poco perché l'identificazione della fase dipende dalla conoscenza dell'inizio del ciclo successivo. Dopo 3 cicli, la durata media del ciclo, i pattern di ovulazione (tramite le variazioni di energia e umore a metà ciclo) e il raggruppamento dei sintomi diventano chiari. Una diagnosi affidabile di PMS/PMDD richiede almeno 2 cicli registrati prospetticamente.
Quando i cambiamenti del ciclo devono portare a una visita medica?
Segnali d'allarme ACOG e Mayo Clinic: cicli costantemente più corti di 21 o più lunghi di 35 giorni, sanguinamento che dura più di 7 giorni, flusso molto abbondante (assorbimento di assorbenti ogni ora), dolore grave non responsivo agli analgesici da banco, sanguinamento tra i cicli o improvvisi cambiamenti del ciclo. Porta almeno 3 cicli di dati dal diario. L'assenza improvvisa delle mestruazioni richiede un test di gravidanza e una valutazione se la gravidanza è esclusa.
Potrebbe piacerti anche
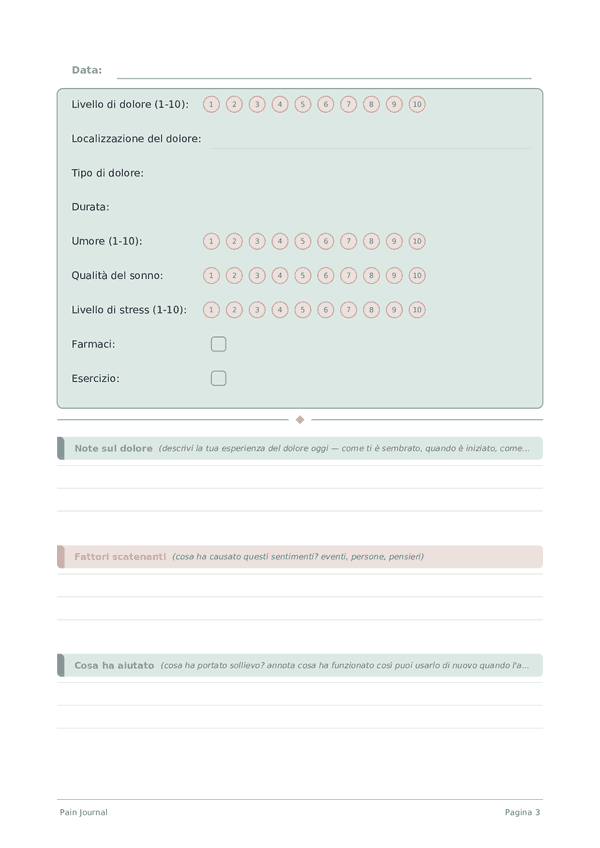
Diario del Dolore
Monitora i pattern del dolore, i trigger e le strategie di sollievo
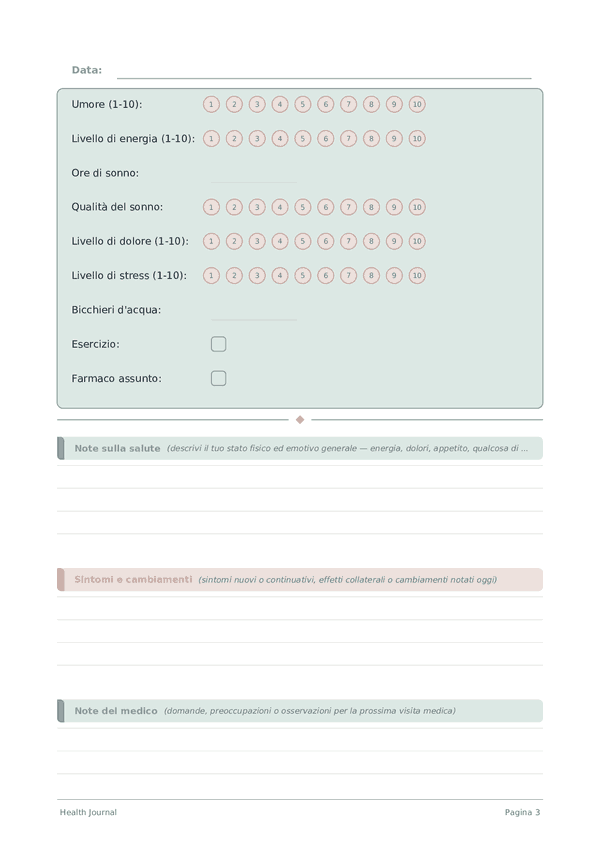
Diario della Salute
Monitora il tuo corpo, la mente e il benessere ogni giorno
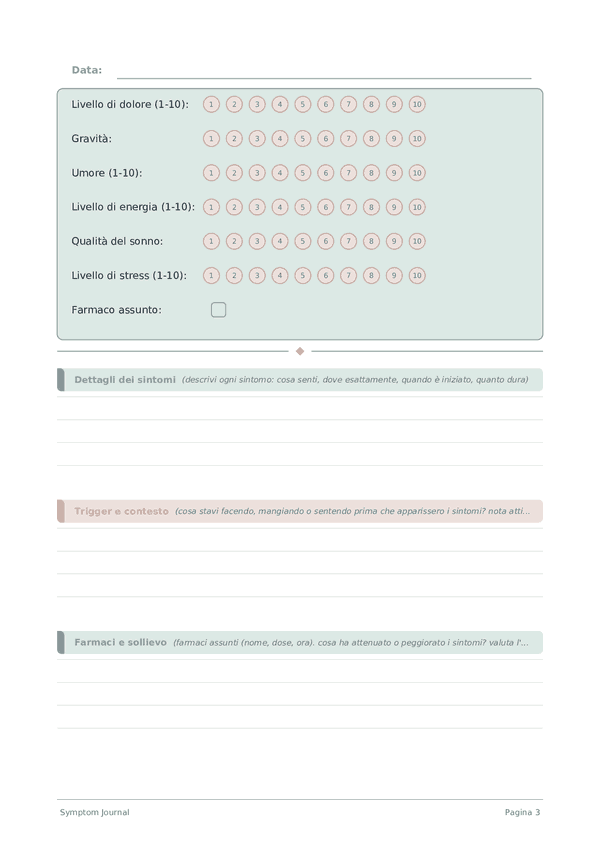
Diario dei Sintomi
Monitora sintomi, trigger e trattamenti ogni giorno
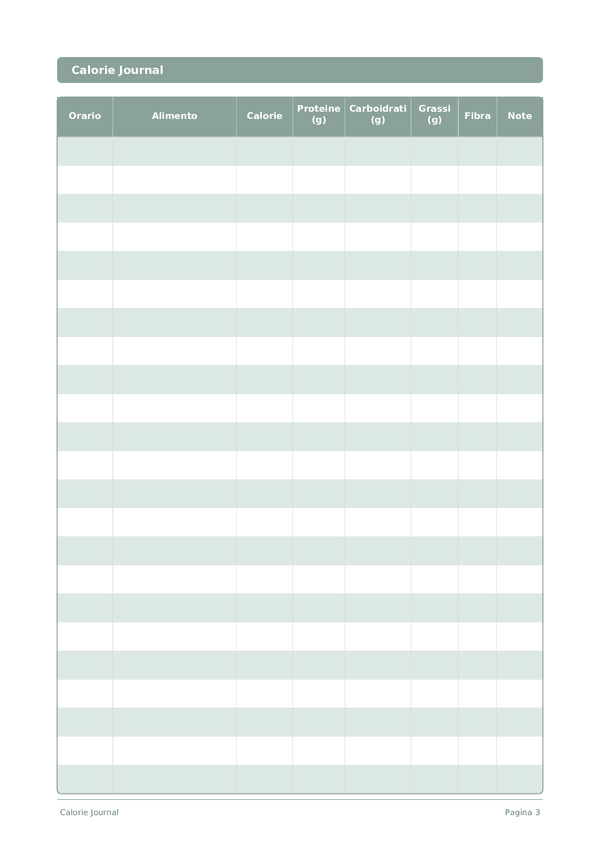
Diario delle Calorie
Monitora calorie e macronutrienti ad ogni pasto
Scorri per ingrandire, trascina per spostare