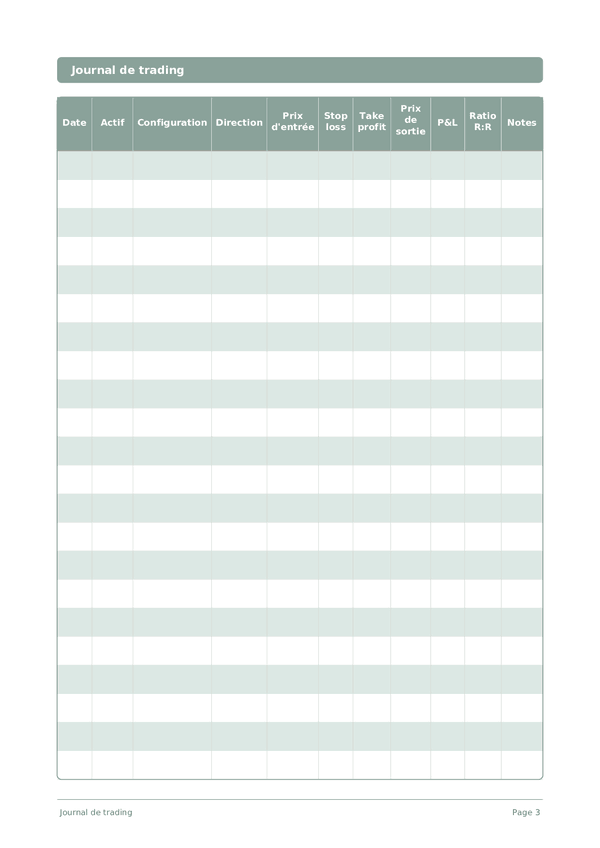
Printable Journal de trading
Suivi des transactions et journal d'analyse de performance
Improve your trading edge with meticulous trade documentation, risk management tracking, and performance analysis. Identify patterns in your wins and losses to become a consistently profitable trader.
Personnaliser les champs
Activez ou désactivez les champs. Cliquez sur le crayon pour renommer, ou ajoutez vos propres champs.
Qu'est-ce que ce journal ?
A Trading Journal is an essential record-keeping tool for anyone who trades stocks, options, forex, or crypto. Each row captures the date, asset traded, setup type, direction, entry price, stop loss, take profit, exit price, profit or loss, risk-to-reward ratio, and notes. By logging every trade, you build a personal dataset that reveals your true edge — or exposes costly patterns you need to fix.
Professional traders universally agree that journaling is one of the highest-leverage habits for improving performance. Without a journal, it is impossible to know whether your strategy is genuinely profitable or whether recent gains are just luck. A well-kept trading log lets you calculate your win rate, average gain-to-loss ratio, and performance by setup type, time of day, or market conditions.
Log every trade immediately after closing the position — not at the end of the week when details have faded. Record your rationale in the notes column: what did the setup look like, what was your thesis, and what emotion did you feel when entering? Review your journal weekly to identify which setups are working and which you should stop trading.
Exemple rempli
Voici à quoi ressemble une entrée typique une fois remplie :
| Date | Actif | Configuration | Direction | Prix d'entrée | Stop loss | Take profit | Prix de sortie | P&L | Ratio R:R | Notes |
|---|---|---|---|---|---|---|---|---|---|---|
| 2025-01-06 | AAPL | Breakout | Long | 248.5 | 245 | 255 | 254.2 | 570 | 1.63 | Clean break above resistance on volume |
| 2025-01-06 | EUR/USD | Pullback | Short | 1.0385 | 1.041 | 1.034 | 1.0342 | 430 | 1.72 | Bearish engulfing on 4H after news catalyst |
| 2025-01-07 | TSLA | Gap fill | Long | 395 | 390 | 405 | 392.1 | -290 | -0.58 | Stopped out early — gap did not hold support |
| 2025-01-08 | BTC/USD | Range break | Long | 97200 | 96000 | 100000 | 99400 | 1100 | 1.83 | Broke 12-day consolidation range on high volume |
| 2025-01-08 | NVDA | Momentum | Long | 148.3 | 146.5 | 152 | 147 | -195 | -0.72 | Entered too late in the move, weak follow-through |
Comment remplir chaque champ
Chaque page est un tableau avec des colonnes. Remplissez une ligne par entrée. Voici à quoi sert chaque colonne :
Date
Inscrivez la date du jour. Cela ancre votre entrée dans le temps et aide lors de la relecture ultérieure.
Actif
Configuration
Direction
Prix d'entrée
Stop loss
Take profit
Prix de sortie
P&L
Ratio R:R
Notes
Ajoutez tout contexte ou réflexion supplémentaire. Cette colonne fourre-tout est pour tout ce qui ne rentre pas ailleurs mais pourrait être utile plus tard.
Conseils pour réussir
Quand et à quelle fréquence écrire
Make a journal entry for every trade — before, during, and after. Before: write your thesis, setup, and planned risk parameters. During: note any deviations from the plan. After: record the outcome, what went right, and what you would do differently. On non-trading days, spend 15 minutes reviewing recent trades and updating your statistics. Weekly, calculate your win rate, average R-multiple, and largest drawdown. Monthly, identify your top three setups by profitability and your worst three by loss — then trade more of the former and less of the latter.
Questions fréquentes
Pourquoi dois-je consigner prix d'entrée, stop loss et take profit avant la clôture du trade ?
Les plans pré-trade exposent la discipline d'exécution post-trade. La SEC/AMF avertit que la plupart des traders actifs perdent de l'argent, souvent parce que les plans dérivent en cours de trade. Écrire stop loss et take profit à l'entrée crée le seul registre honnête pour vérifier si vous avez suivi votre plan. Sans cela, le biais rétrospectif réécrit chaque trade comme intentionnel et l'apprentissage s'arrête.
Comment calculer la colonne ratio R:R ?
Le ratio risque/récompense est (take profit moins prix d'entrée) divisé par (prix d'entrée moins stop loss) pour un trade long, avec inversion des signes pour les shorts. Consigner ratio R:R par trade permet de vérifier si votre type de setup atteint réellement le rapport risque/récompense que vous supposez au moment du dimensionnement des positions.
À quoi sert réellement la colonne setup ?
Un tag court pour le pattern récurrent que vous avez tradé — breakout, retour à la moyenne, news, comblage de gap. Les traders actifs étiquettent rarement leurs setups et ne peuvent donc pas évaluer quelles approches fonctionnent. Des labels de setup cohérents transforment une série de trades en jeu de données triable ; sur 50 à 100 trades, les patterns de pnl par setup révèlent votre véritable edge — ou son absence.
En quoi ce carnet diffère-t-il des relevés de courtier ou des notes TradingView ?
Les données de courtier montrent l'exécution ; ce carnet enregistre l'intention plus l'exécution. La SEC/AMF recommande des registres de trades personnels indépendants des rapports de courtier. Les 11 colonnes — dont setup, direction, stop loss, take profit, ratio R:R et notes — capturent le contexte décisionnel que les relevés de courtier omettent. Sans ce contexte, l'apprentissage post-trade se réduit à l'attribution de la chance.
Tenir un journal de trading améliore-t-il vraiment les performances ?
La documentation soutient le cycle de pratique délibérée que la SEC/AMF recommande à tout investisseur. La SEC/AMF déclare que la plupart des day traders perdent de l'argent ; la revue structurée est l'une des pratiques documentées distinguant ceux qui survivent. Kahneman, *Thinking, Fast and Slow* (2011), montre que la mémoire rétrospective des trades est systématiquement biaisée vers des reconstructions auto-flatteuses.
Que mettre dans la colonne notes pour un trade typique ?
Pourquoi vous avez pris le trade au-delà du tag setup, contexte de marché, état émotionnel et ce qui vous a surpris. Kahneman décrit comment le contexte émotionnel génère des erreurs d'exécution invisibles dans les données de prix. Des notes brèves capturées à la sortie rendent la revue honnête ; les notes reconstruites plus tard sont systématiquement biaisées vers le résultat survenu.
Dois-je journaliser les trades perdants ou seulement les gagnants ?
Les perdants, surtout. La SEC/AMF avertit que la plupart des traders actifs perdent, faisant de l'analyse des pertes la principale source d'amélioration de l'edge. Remplir chaque ligne — prix d'entrée, stop loss, prix de sortie, pnl — particulièrement quand pnl est négatif, construit le jeu de données qui expose les violations de règles et les modes de défaillance des setups. Un journal sélectif produit un jeu de données flatteur et inutile.
Combien de trades consigner avant de réviser ?
Revue hebdomadaire pour la discipline d'exécution ; revue par setup après environ 20 à 30 trades pour le signal statistique. La SEC/AMF souligne que les petits échantillons sont trompeurs. Avec 15 trades par page, un swing trader couvre des mois ; un day trader actif couvre une semaine. Adaptez la cadence de revue à la fréquence d'entrée plutôt qu'à l'habitude calendaire.
Vous aimerez aussi
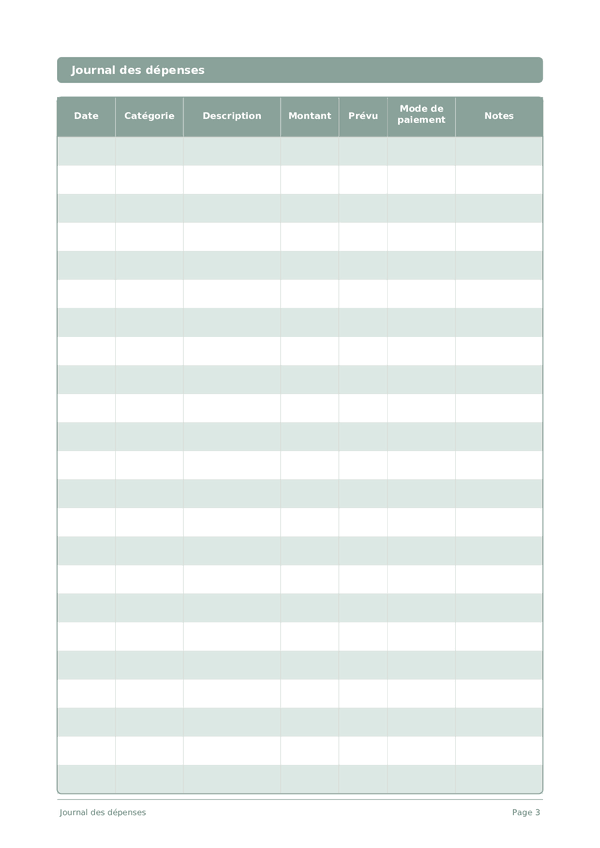
Journal des dépenses
Suivez chaque euro pour prendre le contrôle de vos finances
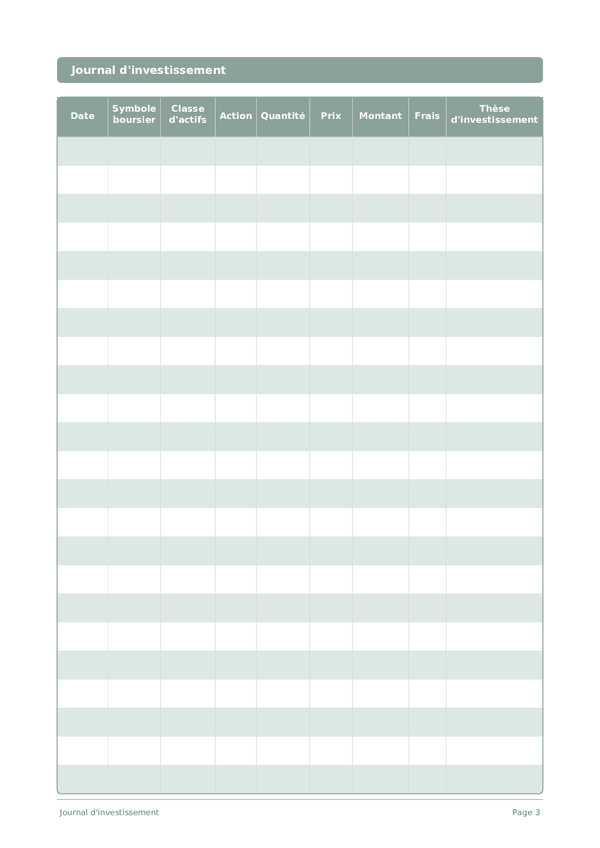
Journal d'investissement
Suivez vos transactions, analysez vos décisions et faites croître votre portefeuille
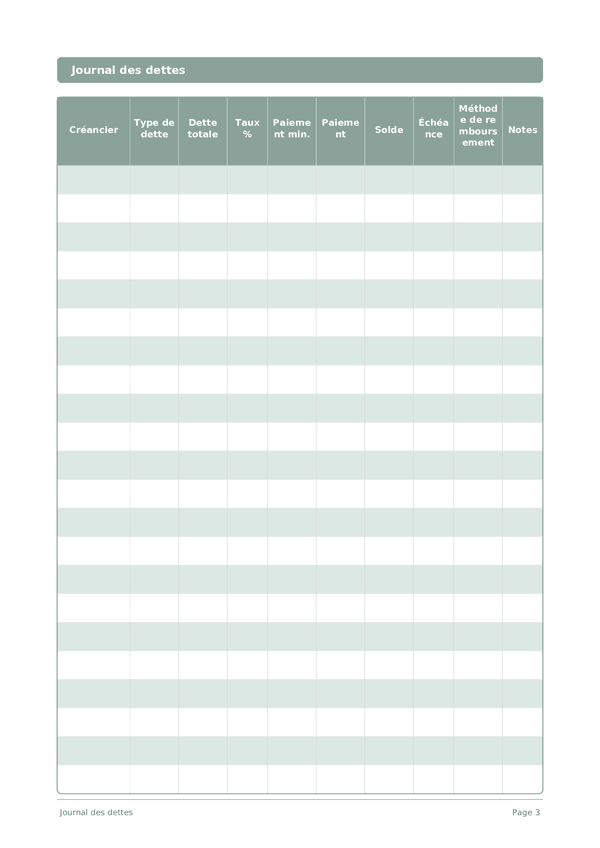
Journal des dettes
Suivez et éliminez vos dettes avec une stratégie de remboursement claire
Journal d'épargne
Suivez vos habitudes d'épargne quotidiennes et progressez vers vos objectifs financiers
Molette pour zoomer, glisser pour déplacer