Printable Diario degli Investimenti
Monitora le operazioni, analizza le decisioni e fai crescere il tuo portafoglio
Personalizza campi
Attiva o disattiva i campi. Clicca la matita per rinominare, oppure aggiungi i tuoi campi.
Cos'è questo diario?
Questo è un diario a registro tabellare — ogni pagina contiene una tabella strutturata con colonne per registrare i dati. Perfetto per tenere traccia di spese, allenamenti, letture o qualsiasi attività che beneficia di voci organizzate e confrontabili.
Come compilare ogni campo
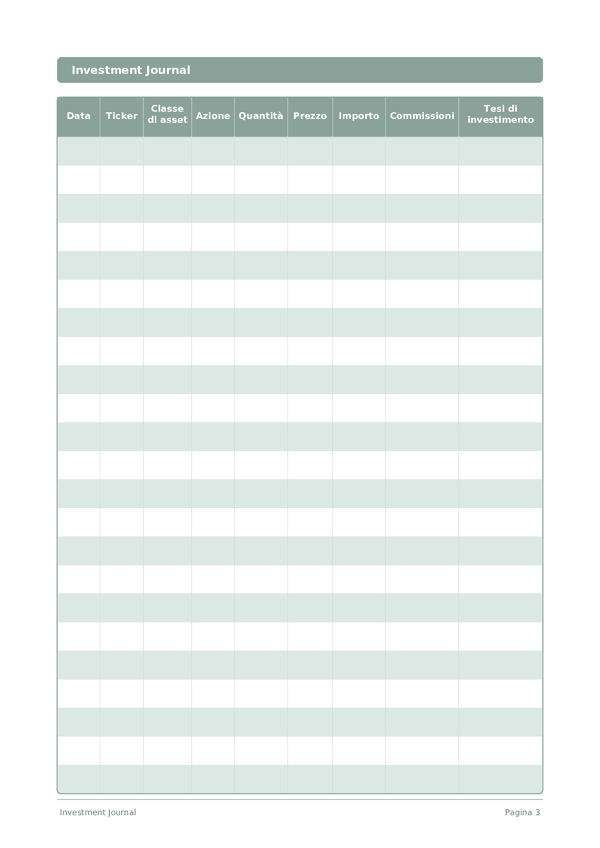
Ogni pagina è una tabella con colonne. Compila una riga per ogni voce. Ecco a cosa serve ogni colonna:
Data
Scrivi la data di oggi. Questo ancora la tua voce nel tempo e aiuta quando si rivedono le voci in seguito.
Ticker
Classe di asset
Azione
Quantità
Prezzo
Quanto hai pagato? Prezzo della bottiglia nella tua valuta locale
Importo
Registra l'importo per questa voce. Sii preciso — gli arrotondamenti creano imprecisioni che si accumulano nel tempo.
Commissioni
Tesi di investimento
Consigli per il successo
Quando e con quale frequenza scrivere
Aggiungi voci man mano che gli eventi accadono durante il giorno. Per i registri finanziari, annota ogni transazione immediatamente. Per i registri di attività, compila dopo ogni sessione. Fai una revisione settimanale o mensile per analizzare i tuoi dati ed estrarre intuizioni.
Domande frequenti
Perché dovrei registrare una tesi di investimento per ogni operazione?
Scrivere il ragionamento al momento dell'acquisto riduce il bias del senno del poi e supporta le revisioni successive. La SEC (2023, investor.gov, 'Investing Quick Tips') invita gli investitori a documentare le decisioni ed evitare il trading emotivo. Kahneman, 'Pensieri lenti e veloci' (Farrar, Straus & Giroux, 2011) mostra che le decisioni catturate per iscritto resistono alla successiva auto-giustificazione. La colonna tesi di investimento di questo modello rende quell'abitudine operativa su ogni riga.
Come uso la colonna classe asset per monitorare la diversificazione?
Etichetta ogni operazione per classe — azioni, ETF, obbligazioni, crypto — poi somma l'importo per classe mensilmente per vedere la deriva dell'allocazione. La SEC (2023, investor.gov, 'Beginners' Guide to Asset Allocation') inquadra la diversificazione come la disciplina centrale della gestione del rischio. Combinare le colonne classe asset e importo trasforma un registro di transazioni in un report sull'allocazione senza software esterno.
In cosa si differenzia questo diario cartaceo da un estratto conto del broker?
Gli estratti conto del broker mostrano cosa hai fatto; questo diario registra perché. Le nove colonne — incluse tesi di investimento, commissioni e classe asset — conservano l'intento accanto all'esecuzione. La SEC (2023, investor.gov, 'Investor Bulletin: Keep Records') raccomanda di conservare registri personali indipendenti dai report del broker per la documentazione fiscale e la revisione delle decisioni, specialmente su più conti o piattaforme.
Perché devo registrare le commissioni su ogni voce?
Le commissioni si accumulano e erodono i rendimenti più di quanto la maggior parte degli investitori stimi. La SEC (2014, 'Investor Bulletin: How Fees and Expenses Affect Your Investment Portfolio') mostra che una commissione annua dell'1% può ridurre il valore di un portafoglio di decine di migliaia nel corso dei decenni. La colonna commissioni di questo modello impone la consapevolezza su ogni operazione invece che una volta l'anno su un estratto conto.
Tenere un diario degli investimenti migliora davvero i risultati?
La documentazione supporta il ciclo di pratica deliberata — registra, rivedi, affina. Il CFPB (2022, 'Tools for Tracking Your Money') approva i registri scritti per qualsiasi attività finanziaria domestica. Anche se nessun diario garantisce rendimenti, scrivere la tesi di investimento e rivedere le voci mensilmente contrasta i documentati bias di overconfidence e avversione alle perdite descritti in Kahneman, 'Pensieri lenti e veloci' (Farrar, Straus & Giroux, 2011).
Questo diario è adatto agli investitori in ETF e fondi indicizzati?
Sì. La colonna classe asset ospita ETF, fondi indicizzati, obbligazioni o singole azioni in modo identico. Anche gli investitori buy-and-hold traggono beneficio dalla registrazione dei versamenti e delle motivazioni — la SEC (2023, investor.gov, 'Mutual Funds and ETFs') raccomanda una revisione periodica dell'allocazione. Per gli investitori a bassa frequenza, la pagina con 12 righe copre circa un anno di versamenti mensili, rendendo la revisione semplice in periodo fiscale.
Quali errori comuni mi aiuta a evitare questo diario?
Due grandi errori — inseguire le performance e dimenticare perché hai comprato. La SEC (2023, investor.gov, 'Investor Alerts') avverte che cambiare strategia in base ai rendimenti recenti distrugge le prestazioni a lungo termine. Compilare il campo tesi di investimento impone una frase di giustificazione; rivederla mensilmente espone gli errori ricorrenti come la sovraconcentrazione, le vendite in preda al panico o l'acquisto ripetuto di narrazioni invece di fondamentali.
Con quale frequenza dovrei rivedere le voci del diario?
La revisione mensile è la cadenza giusta per la maggior parte degli investitori — abbastanza frequente da individuare la deriva, abbastanza infrequente da evitare il trading eccessivo. La SEC (2023, investor.gov, 'Rebalancing Your Portfolio') suggerisce di controllare l'allocazione a intervalli prestabiliti invece di reagire ai movimenti di mercato. Con 12 righe per pagina, una pagina equivale approssimativamente a un ciclo di revisione; esamina insieme le voci tesi di investimento e i totali per classe asset.
Potrebbe piacerti anche
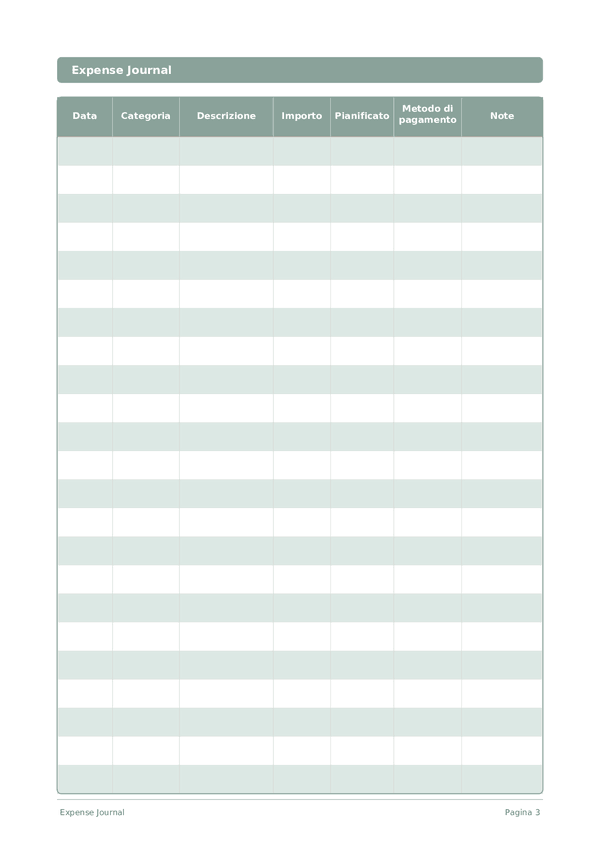
Diario delle Spese
Monitora ogni euro per prendere il controllo delle tue finanze
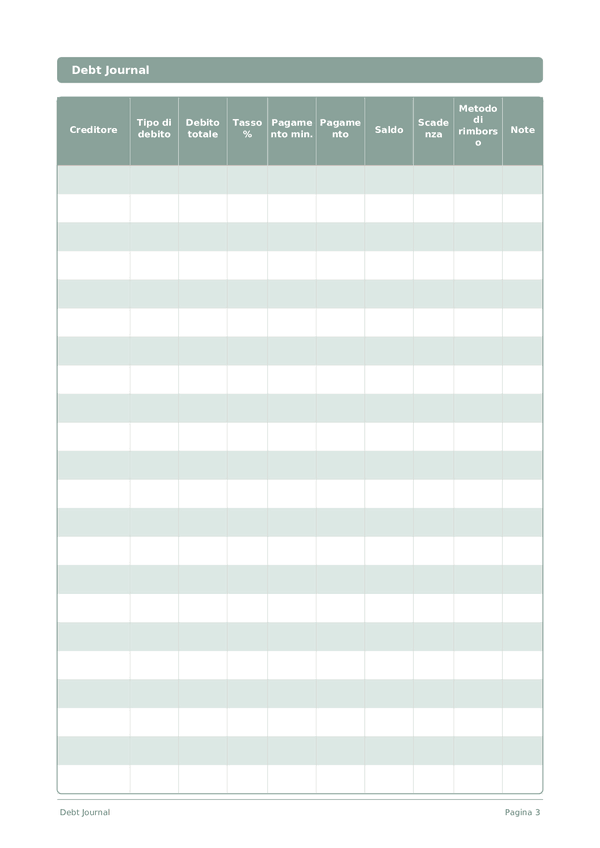
Diario dei Debiti
Monitora ed elimina i debiti con una chiara strategia di rimborso
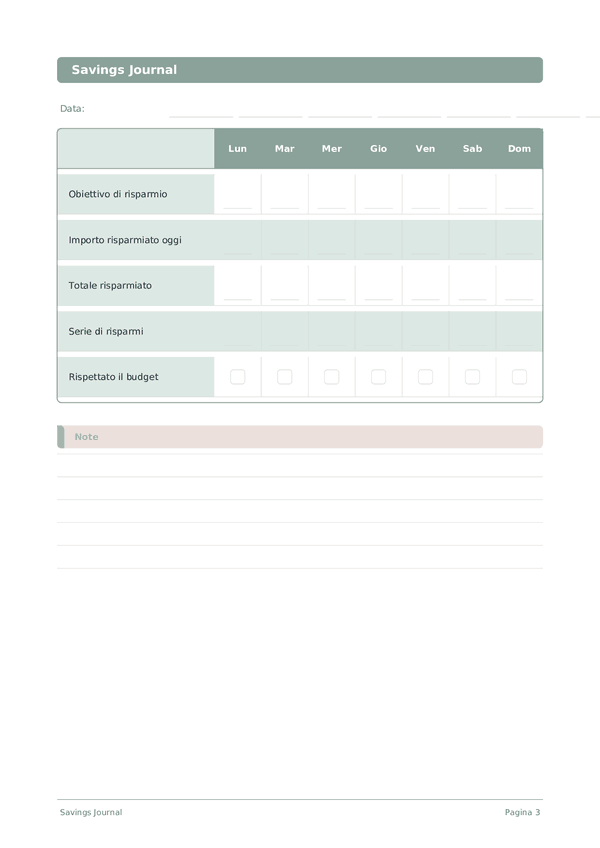
Diario del Risparmio
Monitora le abitudini di risparmio quotidiane e avanzati verso i tuoi obiettivi finanziari
Diario di Carriera
Monitora i risultati e accelera la crescita professionale ogni giorno
Scorri per ingrandire, trascina per spostare