Printable Diario di Trading
Diario di registrazione delle operazioni e analisi delle prestazioni
Personalizza campi
Attiva o disattiva i campi. Clicca la matita per rinominare, oppure aggiungi i tuoi campi.
Cos'è questo diario?
Questo è un diario a registro tabellare — ogni pagina contiene una tabella strutturata con colonne per registrare i dati. Perfetto per tenere traccia di spese, allenamenti, letture o qualsiasi attività che beneficia di voci organizzate e confrontabili.
Come compilare ogni campo
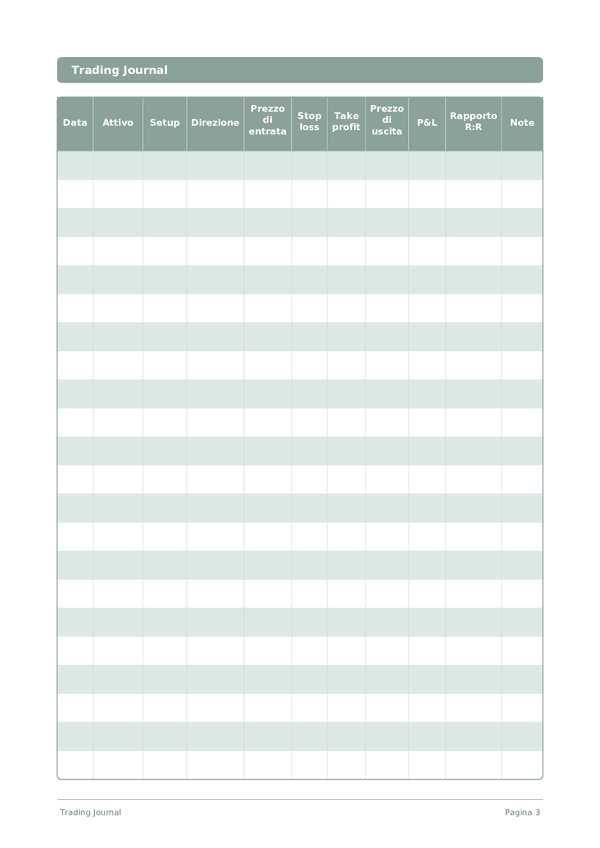
Ogni pagina è una tabella con colonne. Compila una riga per ogni voce. Ecco a cosa serve ogni colonna:
Data
Scrivi la data di oggi. Questo ancora la tua voce nel tempo e aiuta quando si rivedono le voci in seguito.
Attivo
Setup
Direzione
Prezzo di entrata
Stop loss
Take profit
Prezzo di uscita
P&L
Rapporto R:R
Note
Aggiungi qualsiasi contesto o pensiero aggiuntivo. Questa colonna tuttofare è per tutto ciò che non si adatta altrove ma potrebbe essere utile in seguito.
Consigli per il successo
Quando e con quale frequenza scrivere
Aggiungi voci man mano che gli eventi accadono durante il giorno. Per i registri finanziari, annota ogni transazione immediatamente. Per i registri di attività, compila dopo ogni sessione. Fai una revisione settimanale o mensile per analizzare i tuoi dati ed estrarre intuizioni.
Domande frequenti
Perché devo registrare prezzo entrata, stop loss e take profit prima che l'operazione si chiuda?
I piani pre-operazione rivelano la disciplina di esecuzione dopo l'operazione. La SEC (2023, investor.gov, 'Day Trading') avverte che la maggior parte dei trader attivi perde denaro, spesso perché i piani vengono modificati durante l'operazione. Scrivere stop loss e take profit all'apertura crea l'unico registro onesto per verificare se hai seguito il tuo piano. Senza di esso, il senno del poi riscrive ogni operazione come intenzionale e l'apprendimento si ferma.
Come calcolo la colonna rapporto rr?
Il rapporto rischio-rendimento è (take profit meno prezzo entrata) diviso per (prezzo entrata meno stop loss) per un'operazione long, con segni invertiti per le short. La SEC (2023, investor.gov, 'Trading Basics') inquadra la gestione del rischio come la disciplina centrale del trading attivo. Registrare il rapporto rr per operazione ti permette di verificare se il tuo tipo di setup raggiunge effettivamente il rischio-rendimento che assumi quando dimensioni le posizioni.
A cosa serve concretamente la colonna setup?
Un'etichetta breve per lo schema ricorrente che hai tradato — breakout, mean-reversion, notizie, gap-fill. La SEC (2023, investor.gov, 'Investor Bulletin: Day Trading') osserva che i trader attivi raramente etichettano i setup e quindi non riescono a valutare quali approcci funzionano. Etichette di setup coerenti trasformano una serie di operazioni in un dataset ordinabile; dopo 50–100 operazioni, gli schemi di P&L per setup rivelano il tuo vero vantaggio — o la sua assenza.
In cosa si differenzia questo diario dagli estratti conto del broker o dalle note di TradingView?
I dati del broker mostrano l'esecuzione; questo diario registra l'intenzione più l'esecuzione. La SEC (2023, investor.gov, 'Investor Bulletin: Keep Records') raccomanda registri personali delle operazioni indipendenti dai report del broker. Le 11 colonne — incluse setup, direzione, stop loss, take profit, rapporto rr e note — catturano il contesto decisionale che gli estratti conto del broker omettono. Senza quel contesto, l'apprendimento post-operazione si riduce all'attribuzione alla fortuna.
Tenere un trading journal migliora davvero le prestazioni?
La documentazione supporta il ciclo di pratica deliberata che la SEC raccomanda ripetutamente per qualsiasi investitore. La SEC (2023, investor.gov, 'Day Trading') afferma che la maggior parte dei day trader perde denaro; la revisione strutturata è una delle pratiche documentate che distingue chi sopravvive. Daniel Kahneman, 'Pensieri lenti e veloci' (Farrar, Straus & Giroux, 2011) mostra che la memoria a posteriori delle operazioni è sistematicamente distorta verso ricostruzioni auto-lusinghiere.
Cosa va nella colonna note per un'operazione tipica?
Perché hai preso l'operazione al di là dell'etichetta del setup, il contesto di mercato, lo stato emotivo e cosa ti ha sorpreso. Daniel Kahneman, 'Pensieri lenti e veloci' (Farrar, Straus & Giroux, 2011) descrive come il contesto emotivo guidi gli errori di esecuzione che sono invisibili nei dati di prezzo. Brevi note catturate all'uscita rendono onesta la revisione successiva; le note ricostruite sono sistematicamente distorte verso l'esito che si è verificato.
Dovrei tenere traccia delle operazioni in perdita o solo di quelle vincenti?
Soprattutto delle perdite. La SEC (2023, investor.gov, 'Day Trading') avverte che la maggior parte dei trader attivi perde, rendendo l'analisi delle perdite la principale fonte di miglioramento del vantaggio competitivo. Compilare ogni riga — prezzo entrata, stop loss, prezzo uscita, P&L — in particolare quando il P&L è negativo, costruisce il dataset che espone le violazioni delle regole e i modi in cui i setup falliscono. Un diario selettivo produce un dataset lusinghiero e inutile.
Quante operazioni dovrei registrare prima di fare una revisione?
Rivedi settimanalmente per la disciplina di esecuzione; rivedi per setup dopo circa 20–30 operazioni per un segnale statistico. La SEC (2023, investor.gov, 'Investor Bulletin: Day Trading') sottolinea che i campioni piccoli sono fuorvianti. Con 15 operazioni per pagina, un trader swing copre mesi; un day trader attivo copre una settimana. Adatta la cadenza di revisione alla frequenza delle operazioni invece che all'abitudine calendariale.
Potrebbe piacerti anche
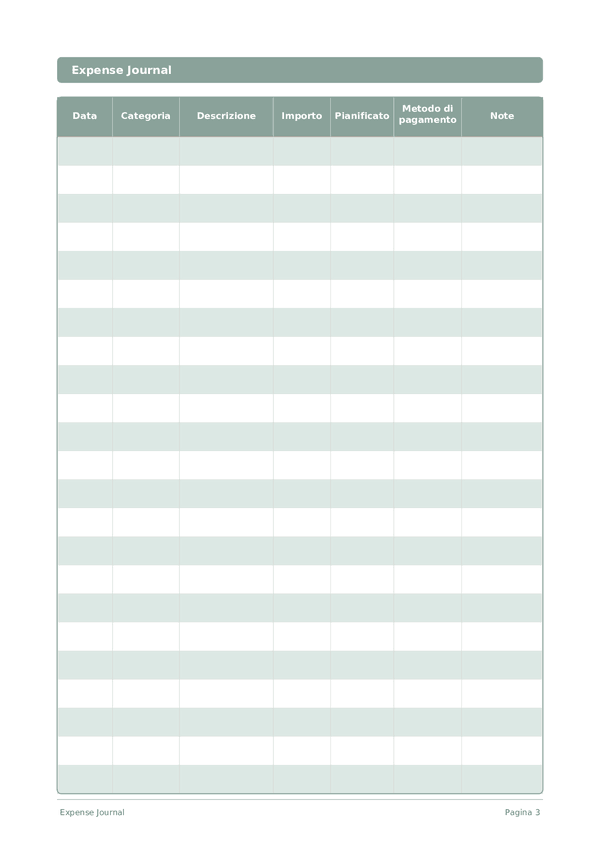
Diario delle Spese
Monitora ogni euro per prendere il controllo delle tue finanze
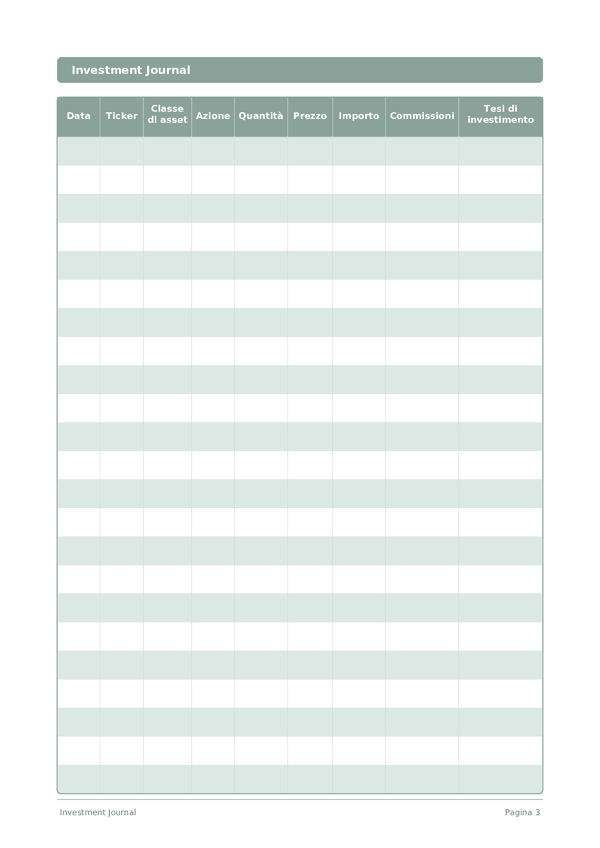
Diario degli Investimenti
Monitora le operazioni, analizza le decisioni e fai crescere il tuo portafoglio
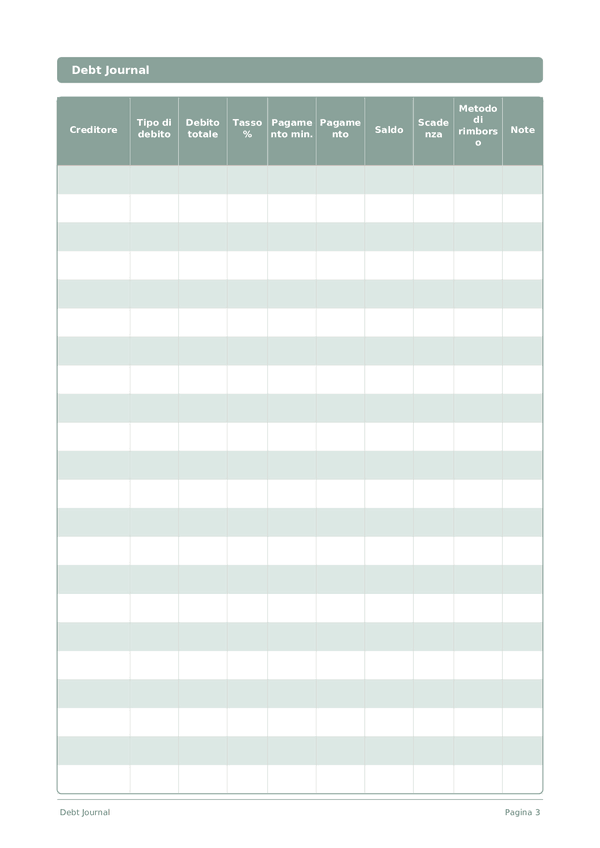
Diario dei Debiti
Monitora ed elimina i debiti con una chiara strategia di rimborso
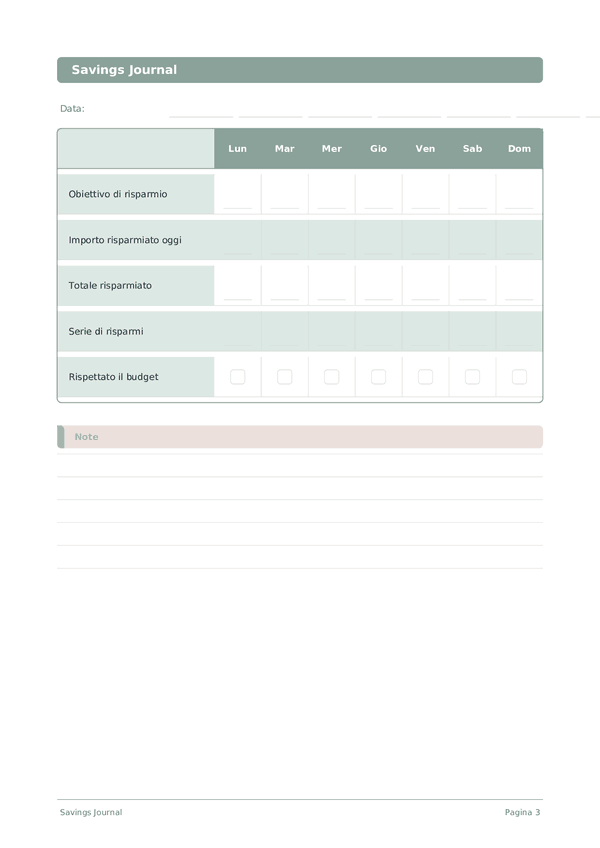
Diario del Risparmio
Monitora le abitudini di risparmio quotidiane e avanzati verso i tuoi obiettivi finanziari
Scorri per ingrandire, trascina per spostare